Executive Summary
Solid inclusions within transparent host minerals such as zircon are known to record valuable information for geochronology, paleoenvironment, and provenance studies. Furthermore, they provide valuable targets for downstream microanalysis, for example by secondary ionization mass spectrometry (SIMS) or laser ablation inductively coupled plasma mass spectrometry (LA-ICP-MS). However, traditional manual inspection methods – microscopy based inclusion detection followed by Raman identification – are time consuming, and difficult to achieve for larger sample sets.
This Application Note presents a semi‑automated, particle‑in‑particle workflow developed using the Oxford Instruments witec360 Raman microscope, ParticleScout, WITec Control SEVEN, and Python‑based COM automation. Validated using zircon separates from Curtin University and Heidelberg University, the workflow delivers fast, reliable detection of opaque inclusions and automated Raman characterization with reasonable operator intervention.
The result: a robust, reliable, scalable, and high‑throughput solution to identify inclusions for laboratories working with transparent host minerals.
Introduction
Solid inclusions embedded in minerals such as zircon serve as key indicators of mineral growth histories, magmatic evolution, and post‑crystallization processes. They also bear a great potential as targets for isotopic analysis, which prominently includes carbon isotopic measurements of graphite inclusions in Hadean zircon (~ 4.1 billion years) to detect their potential biogenic origins [1]. The automation of this workflow was driven by the need to efficiently screen large zircon populations to identify rare carbonaceous inclusions such as graphite that may preserve remnants of sediment‑derived organic components incorporated into magmatic systems. However, tests on late Proterozoic granitic rocks (~ 1-0.54 billion years) with a sedimentary provenance have indicated that less than 3% of inclusion-bearing zircon grains contain graphite inclusions suitable for further SIMS analysis [2, 3]. The abundance of graphite-bearing minerals dramatically decreases to about 0.1‰ [1] for rock units containing the oldest known zircons on Earth, requiring the screening of zircon populations in the range of up to several tens of thousands of grains.
Previously, screening required a fully manual sequence applied to each individual zircon to detect and identify compelling inclusions:
- Screen mineral populations to preselect inclusion-bearing zircons
- Visually identify inclusions and note their x-y-z positions
- Manually locate zircon grains on the sample mount
- Capture images for documentation (high magnification, brightfield white light)
- Manually focus on each inclusion using Raman peak intensities
- Acquire individual Raman spectra for material identification
- Perform optional 2D Raman images for multiphase inclusions
- Select suitable inclusions for downstream techniques such as SIMS
While effective, this conventional workflow is:
- Fully manual
- Time‑consuming
- Operator‑dependent
- Difficult to scale for high‑sample‑volume environments
To overcome these limitations, we developed a semi‑automated workflow that replaced manual sequence, which integrates:
- wide‑area imaging and zircon segmentation,
- targeted inclusion segmentation by high‑magnification inspection, and
- automated inclusions characterisation by confocal Raman analysis.
This approach improves throughput, reduces operator workload, and ensures consistent and objective results for investigating thousands to tens of thousands of inclusion-bearing minerals, which need to be searched to successfully detect and identify carbon-bearing phases incorporated within zircon populations from some of the oldest rock units available on Earth’s surface.
Instrumentation
All measurements were executed on an Oxford Instruments witec360 Raman microscope equipped with following features:
- Reflection and transmission white‑light illumination
- 10x and 50x objectives used in brightfield (BF) and darkfield (DF)
- Additionally, 90° crossed polariser-analyser (xPol)
- Hexalight 600 spectrometer with 300 g/mm grating
- Back‑illuminated VIS CCD detector
- 532 nm excitation laser with TruePower and TrueComfort white light automation
Image acquisition and automation via WITec Control SEVEN, ParticleScout, and Python COM scripting.
Workflow Overview
A five‑stage workflow was developed for detecting and characterizing opaque mineral inclusions in transparent host materials. This reduced‑workload approach includes following stages:
-
Preliminary testing [once per host material]:
- Sample mount type property evaluation – Determine suitable sample conditions (resin/mount materials) for further distinguishing and optimisation in step 2.
- Segmentation optimized illumination evaluation – Iterative illumination and white‑light setting optimization to:
- Ensure sufficient contrast between zircons, the mount material, and opaque inclusions.
- Define suitable thresholds with stable segmentation performance for zircon and inclusion detection with less artefacts as possible using ParticleScout.
-
Semi‑automated workflow stages (Figure 1):
3. Low‑Magnification Grain Localization – Simple and fast host grain (zircon) wide‑area image stitching and ParticleScout segmentation.
4. High‑Magnification Inclusion Detection – Acquire detailed images of each grain (python script) and segment opaque inclusions (ParticleScout).
5. Raman‑Based Inclusion Identification – Automate autofocus and collect Raman spectra for material characterization (python script).
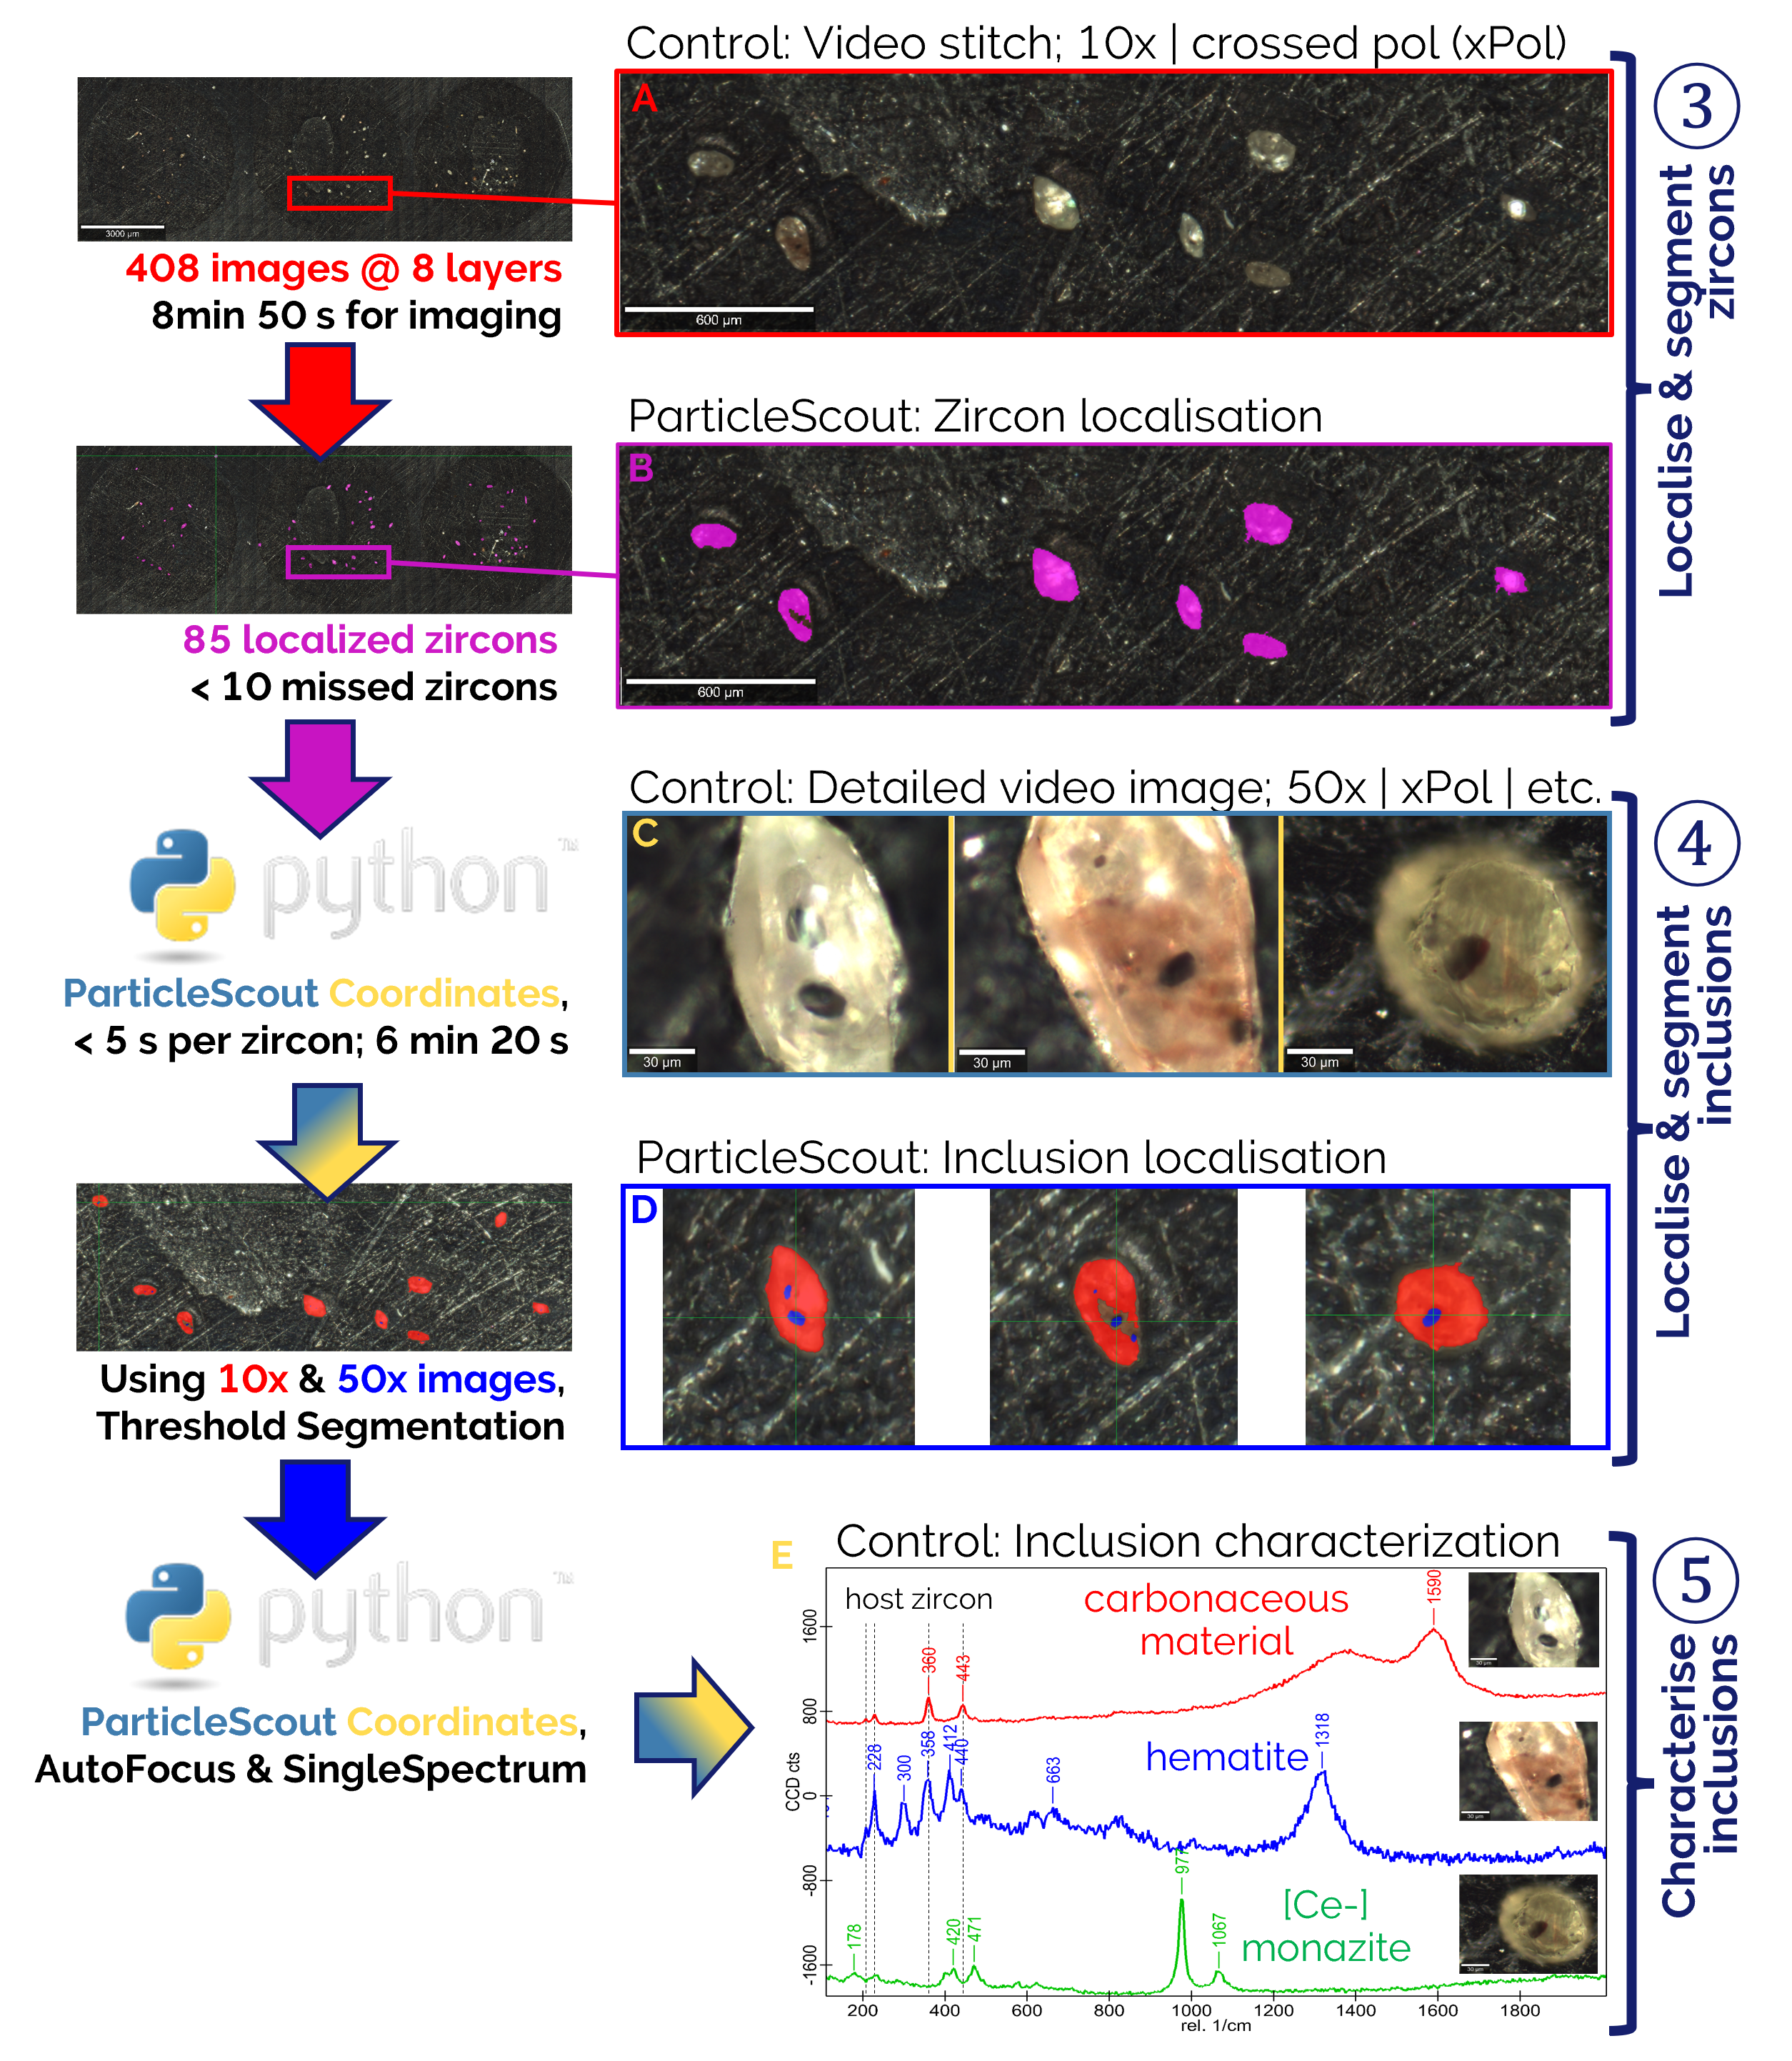
Figure 1: Overview of the semi‑automated workflow stages 3-5 for detecting and characterizing opaque inclusions in transparent zircon grains. The workflow integrates low‑magnification grain localization, high‑magnification inclusion detection, and automated Raman‑based identification using WITec Control SEVEN, ParticleScout, and python‑based COM automation scripting.
Step-by-Step Guide
Step 1: Evaluation of sample mount properties
Two types of sample mounts to investigate zircon grains were evaluated:
- Zircon grains embedded in epoxy resin mounts (Figure 2).
- Zircon separates pressed embedded into "soft" indium mounts (Figure 3).
Although zircon segmentation works well in reflected light on epoxy mounts, opaque inclusions cannot be detected with any reflected‑light configuration (Figure 1A). Transmitted light reveals inclusions but prevents reliable zircon segmentation due to diffuse contrast, shading, and internal reflections (Figure 1B). Because neither illumination mode provided sufficient control for epoxy‑mounted samples, indium mounts were selected as the appropriate sample type. The following section summarizes the illumination conditions that yielded the most reliable inclusion visibility for both reflected‑light imaging and Raman spectroscopy (Figures 3,4).
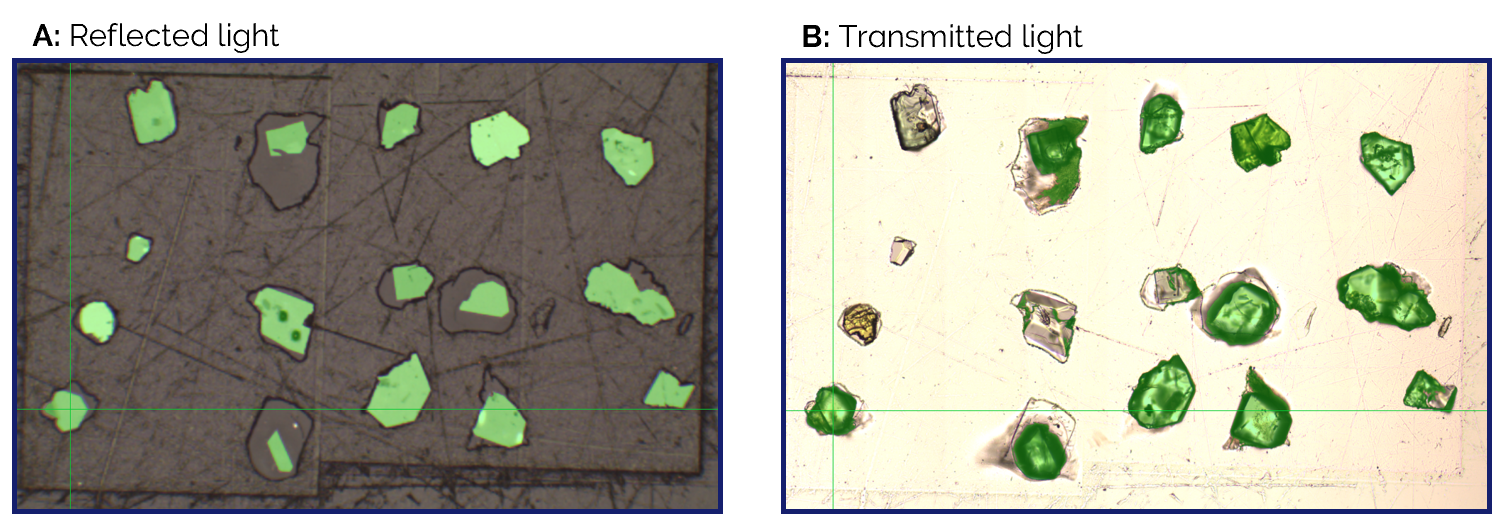 Figure 2: Reflected light image of epoxy resin mounted zircon grains which enables segmentation, but inclusions remain invisible [A]; transmitted light reveals inclusions but prevents reliable zircon segmentation [B], motivating the use of indium-mounted samples. Colour code: green = segmented region.
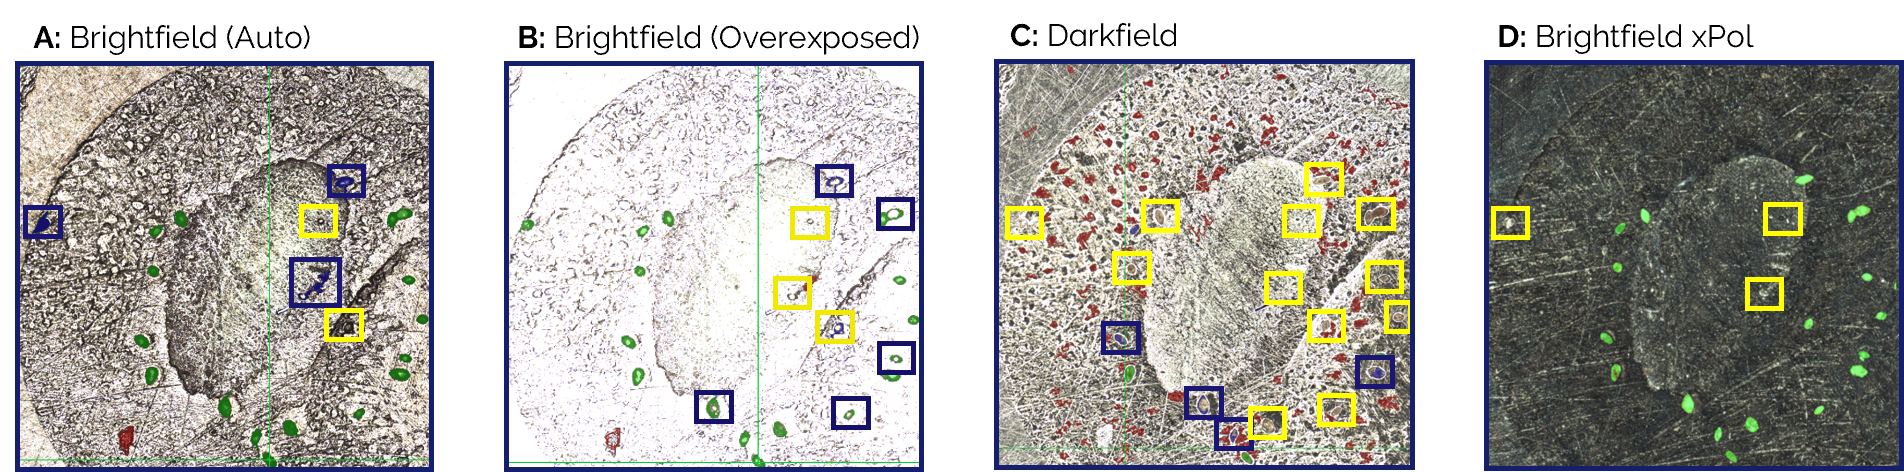 Figure 3: Illumination comparison using the 10x objective on indium‑mounted zircons. Brightfield shows zircon grains but suffers from reflections [A, B]; darkfield reveals inclusions but introduces strong artefacts [C]. Crossed‑polariser brightfield provides the cleanest images and best contrast [D]. Segmentation colours: green = correct, red = errors, blue = outline errors, yellow = missed particles.
Step 2: Evaluation of segmentation optimized illumination
Initial tests with the 10x and 50x objectives showed that crossed‑polariser brightfield illumination consistently delivered the best imaging performance across magnifications. In xPol configuration the 10x objective produced clean, artefact‑free images that enabled reliable zircon recognition and provided a strong basis for downstream segmentation (Figure 3). Image quality improved even further using the 50x/0.55 objective: zircons were clearly distinguishable under all brightfield modes, and inclusion contrast increased predictably with exposure, with xPol offering the most homogeneous and artefact‑free results for contrasting inclusion (Figure 4).
Segmentation behaviour in ParticleScout followed these optical observations. At 10x and 50x, zircon segmentation was robust across brightfield settings, requiring only minimal filtering. Crossed-polariser illumination provided consistently clear segmentation of zircons (10x/50x) and opaque inclusions (50x). Among all tested configurations, the 50x long‑distance objective combined with crossed polarisers proved to be the most effective overall, offering reliable zircon segmentation and strong inclusion detectability – representing the preferred choice for subsequent workflow stages. To optimize downstream imaging time, a two-step approach with 10x (zircon recognition) and 50x (inclusion segmentation) was chosen.
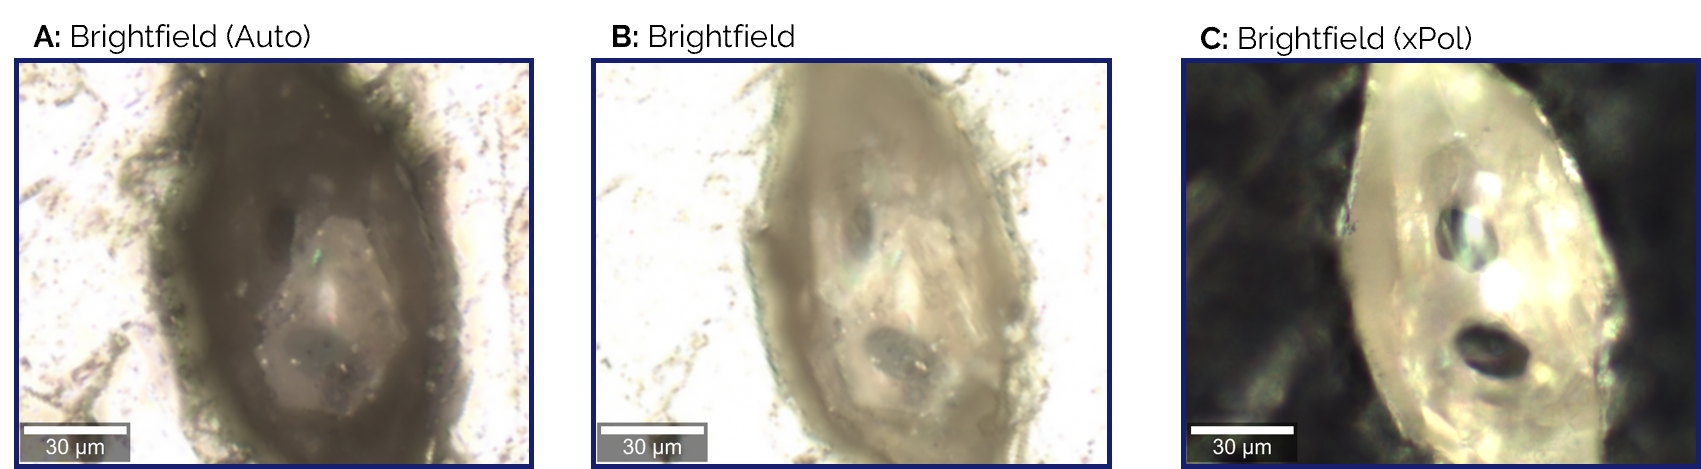 Figure 4: Comparison of illumination modes in brightfield using the 50x objective. All modes show clear zircon visibility, with crossed‑polariser brightfield providing the most homogeneous images and best contrast for zircon and inclusion segmentation.
Step 3 – Low‑magnification localization and segmentation of zircon host minerals
Imaging Configuration:
- 10x objective under crossed polariser-analyser
Acquisition:
- 408 stitched images at 8‑layer focus stacking covering 17.8 x 5.9 mm²
- Total time [speed]: 8 min 50 s [5 s/mm²]
Segmentation parameters (Figure 5):
ParticleScout identified zircon grains from the stitched images using bright particles watershed mode with 85 background and 25 detection thresholds (Figure 5A-C). To reduce artefacts an erroneous particle segmentation, further limits were set on excluding edge particles and setting particle property filters (area ≥ 6000 µm², circularity ≥ 0.4) (Figure 5D). By these restrictions following segmentation performance was achieved:
- 85 zircons were localized on 3 Indium mounts
- Efficient artefacts exclusion (e. g. from scratches)
- Less than 10% missed zircons (primarily due to indium surface artefacts, which can be further compensated by improvements in sample preparation)
Gained time saving:
Time savings are achieved because high magnification image stitching (e.g., 50x at 115 s/mm²) no longer needs to be performed across the entire sample area. Instead, x y coordinate recognition with the 10x objective at 5 s/mm² provides a 23 fold faster zircon localisation.
Output:
Exported x-y coordinates of all zircon locations used in a python script for following automated high magnification imaging and inclusion segmentation in step 4.
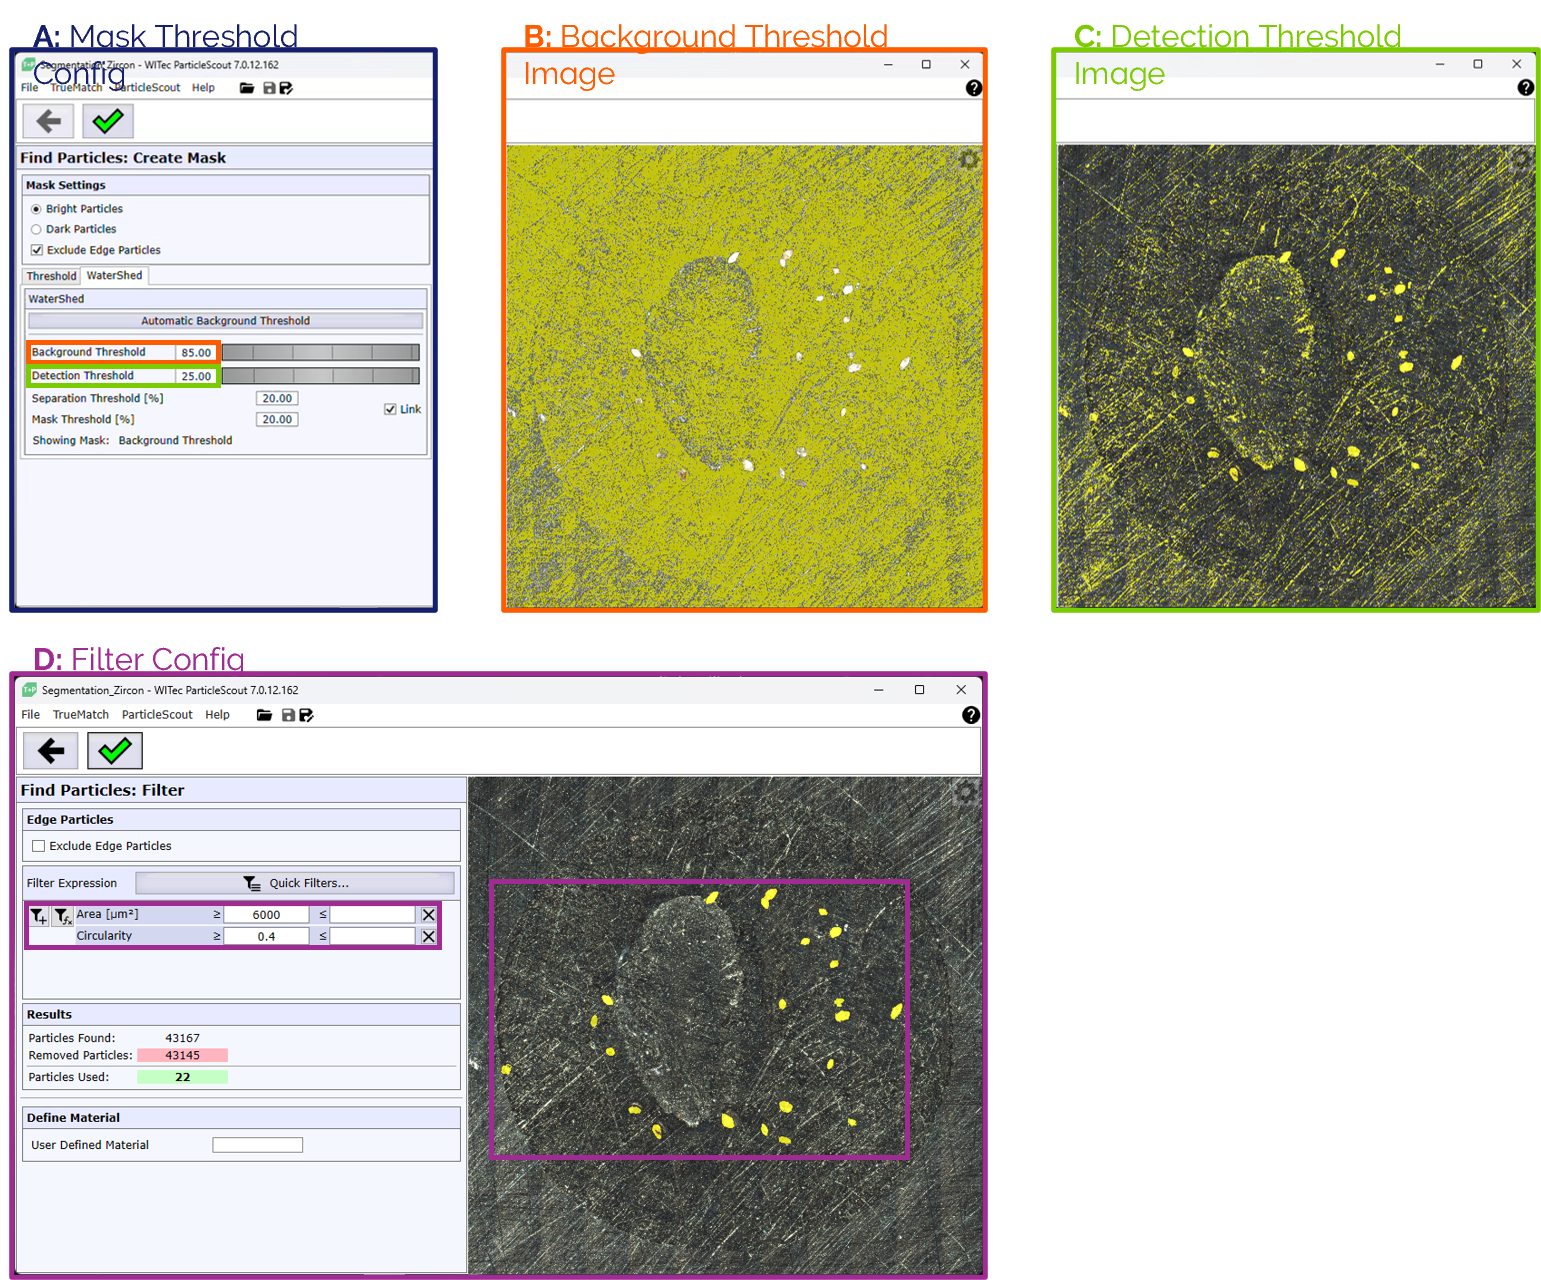 Figure 5: ParticleScout segmentation of zircon grains from stitched 10x crossed‑polariser images. Bright‑particle watershed thresholds enable reliable grain detection [A] (background = 85 [B]; detection = 25 [C]), while edge‑particle exclusion and property filters (area ≥ 6000 µm²; circularity ≥ 0.4) reduce and exclude artefacts [D].
Step 4 – High‑magnification imaging and segmentation of inclusions
Imaging Configuration:
- 50x long working distance objective for better Inclusion recognition
- Crossed polarization for enhanced inclusion contrast and indium mount fade out
Acquisition & Automation:
- A Python script used the x-y-coordinates from Step 3 to automatically perform an autofocus with closed field-stop blend and acquire high resolution stacked images at each grain position
- 85 images covering 3 indium mounts
- Total time [speed]: 6 min 20 s [~4.5 s/grain]
Segmentation parameters (Figure 6):
ParticleScout distinguished the dark, opaque inclusions from transparent zircon hosts by crossed polarizer images provided the best inclusion contrast. Threshold based segmentation and shape filters yielded clear discrimination. A dark particles threshold mode with mask thresholds between 108-145 was used for each grain individually due to changing reflectivity, internal light reflexes and colour. To fade out the dark indium mount edge particles were excluded (Figure 6A); to reduce artefacts and avoiding erroneous segmentation of too small or irregular inclusions, further inclusion property filters were used (area ≥ 20 µm², circularity ≥ 0.6) (Figure 6B). By these restrictions ParticleScout segmentation performance was achieved as follows (Figure 6C):
- 152 inclusions were localized within 85 zircons on 3 Indium mounts
- Efficient artefacts exclusion (e. g. from colour shading)
- Opaque inclusions were reliably detected; transparent inclusions were visible but more difficult to segment in crossed polarizers.
Gained time saving:
Time savings are achieved because high magnification imaging and inclusion segmentation are restricted to the grain areas and add only minimal overhead to the overall process – around 5 s per particle – keeping the complete segmentation workflow roughly 10-times faster.
Output:
Exported x-y coordinates of all inclusion locations used in a python script for following automated Raman characterization in Step 5.
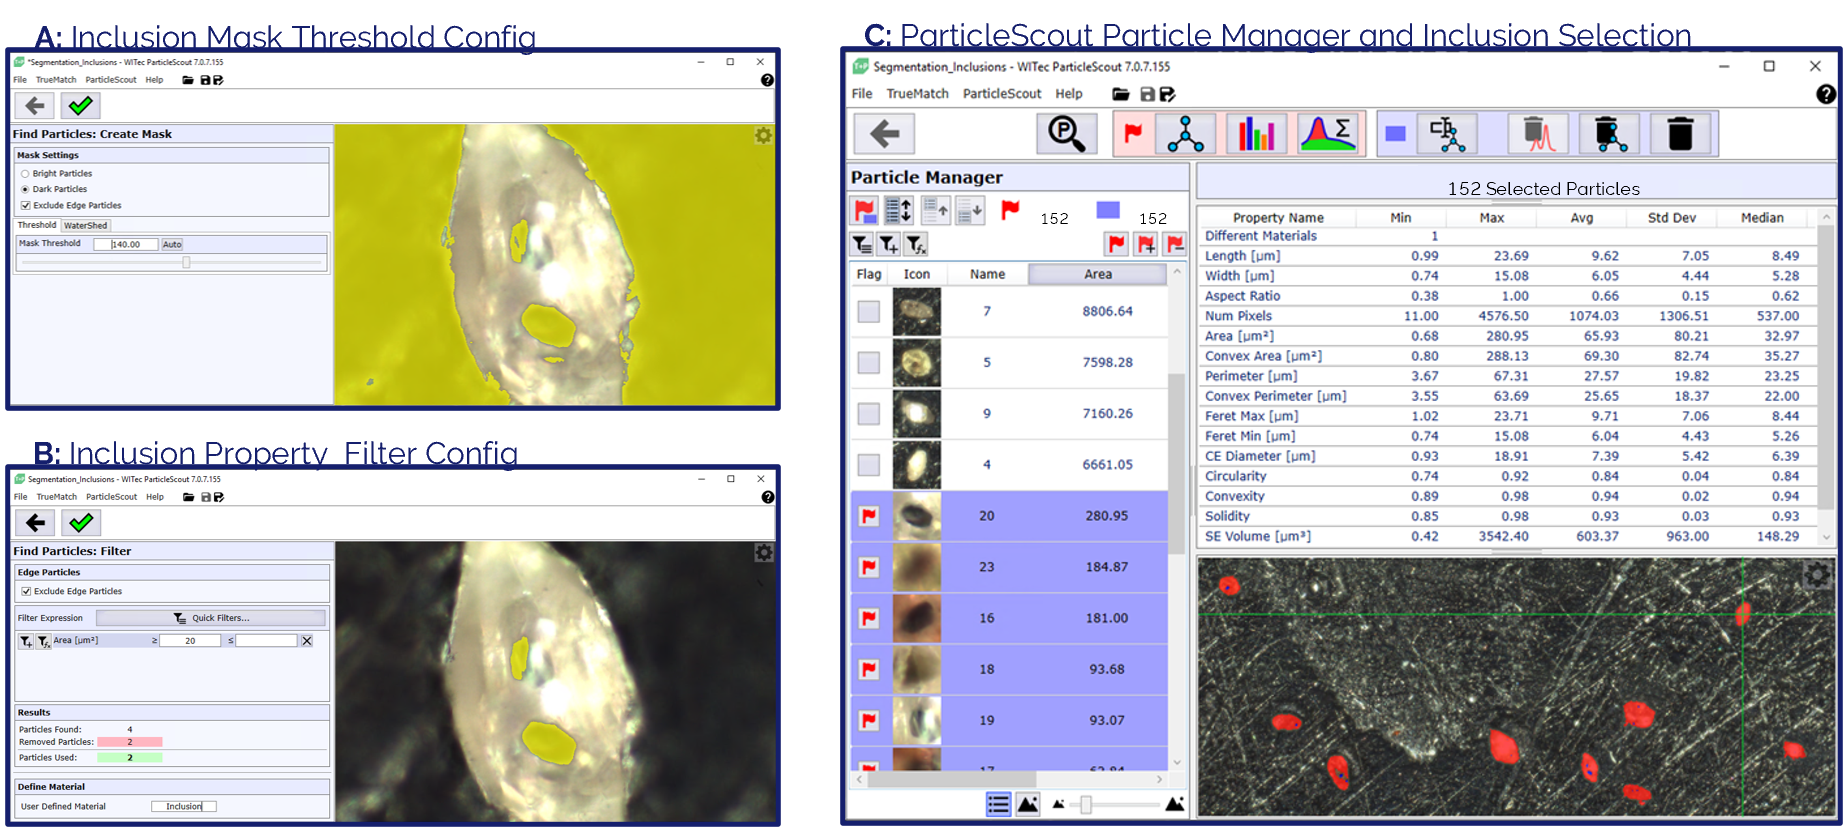 Figure 6: Segmentation workflow for detecting opaque inclusions in zircon grains. Mask threshold identifies opaque inclusion; indium‑mount area is excluded to suppress mount artefacts by using the exclude edge-particle function [A]. Inclusion‑property filters (area ≥ 20 µm², circularity ≥ 0.6) remove small or irregular artefacts [B]. The resulting ParticleScout segmentation reliably detects 152 inclusions (blue) within 85 zircon grains (red) across three mounts [C].
Step 5 – Automated Raman characterization
The spectral autofocus routine in ParticleScout is optimized for speed, using three z‑profile reference points to locate signal maxima. While effective for particles with a single strong Raman signal and a rather small z‑range, this approach becomes unreliable for small inclusions (< 5 µm) embedded in zircon that may lie across larger z‑displacements (exceeding 100 µm). This demands a higher‑precision and wider‑range autofocus routine. To ensure consistent focusing, we implemented a Python‑based automation workflow using the standard high‑accuracy autofocus in WITec Control SEVEN, which greatly improves focus reliability and Raman spectral quality. In addition, Python‑based automation enables optional 2D‑ or 3D‑Raman imaging when more detailed spatial information is required.
Acquisition & Automation:
A Python script loops through all segmented inclusion coordinates received from Step 4 and automates the following steps:
- Closes the field‑stop aperture and performs a white‑light autofocus to compensate for mount curvature.
- Performs a spectral autofocus to accurately determine the centre position of the inclusion.
- Acquires a single‑spectrum Raman measurement from the inclusion.
- Optionally includes 2D‑ or 3D‑Raman imaging for inclusions requiring additional spatial characterization.
Identified inclusion types included (Figure 7):
- Background zircon host peaks
- Carbonaceous phases (D/G bands)
- Hematite (Fe2O3)
- Ce‑monazite (Ce[PO4])
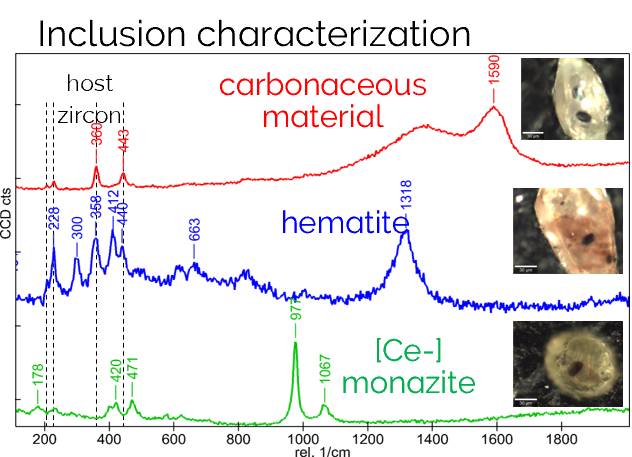 Figure 7: Selected spectra from opaque inclusion types found by the automated measurements of inclusions embedded within transparent zircons. Material of interest for further observations using mass spectroscopy was the carbonaceous materials.
Troubleshooting and Common Challenges
Preliminary testing
Optimizing the workflow starts with careful testing of illumination settings, sample‑mount properties, zircon embedding into indium, and segmentation reproducibility. Because materials and mounts vary, parameters must be fine‑tuned and regularly re‑evaluated to ensure consistent, high‑quality segmentation. With advanced white‑light capabilities – full polarization and Köhler illumination, as well as automated reflected/transmitted light, brightfield/darkfield, DIC, focus stacking, and seamless stitching – the system provides the flexibility needed to effortlessly adapt imaging conditions to changing sample properties, delivering stable contrast, reliable segmentation, and excellent image clarity from the outset.
Crossed-polarizer setting (xPol)
The xPol configuration in the white‑light beam path uses a 0° polarizer before the objective and sample, paired with a 90° analyser positioned after the sample and before the camera. This optimized setup delivers high‑contrast imaging of transparent zircon hosts while effectively suppressing reflections from the mount material—ensuring crisp, artifact‑free visuals for reliable inclusion detection.
High Throughput and Reliable Grain Localization
Crossed‑polarized low‑magnification imaging delivers precise zircon grain segmentation even when the indium surface is not perfectly prepared. Enhanced polishing and planarization of the indium mount further boost segmentation reliability by reducing artefacts and preventing mis‑segmented regions. High‑quality sample preparation therefore becomes a direct driver of faster processing, greater consistency, and minimal need for manual corrections.
High Performance Inclusion Detection & Segmentation
Using a 50x objective in crossed polarized brightfield mode delivers outstanding visibility for opaque inclusions, ensuring that even subtle features are revealed with exceptionally clean and reliable inclusion detection across a wide variety of zircon grains. To guarantee consistently high performance across diverse grain types, the workflow incorporates several targeted optimization strategies:
Imaging & Illumination Enhancements
- Grain‑dependent optimization: Larger grains benefit from focus stacking for maximum clarity, while smaller grains can be imaged quickly and effectively without it.
- Adaptive illumination: Fine‑tuned lighting compensates for differences in grain colour, size, and reflectivity—ensuring optimal contrast in every scenario.
- Optimized illumination per subgroup: Tailored lighting settings for each grain category further stabilize segmentation performance.
Segmentation Stability & Efficiency
- Smart grain grouping: Pre‑classifying grains by optical behaviour (e.g., colour or reflectivity) allows threshold settings to be reused or automated, dramatically reducing manual adjustments and boosting workflow efficiency.
- Robust thresholding under crossed polarization: This illumination mode delivers exceptionally clean inclusion detection and minimizes artefacts—even when optical properties vary widely.
Together, these refinements create a powerful, high‑confidence imaging and segmentation pipeline that maximizes inclusion visibility, reduces user intervention, and ensures fast, reliable, and analytically robust results across all sample types.
Maximum Workflow Efficiency and Superior Analytical Quality
The two step segmentation workflow delivers the strongest combination of speed, segmentation accuracy, and imaging quality, representing the recommended choice for high throughput environments. It outperforms both manual and single step automated approaches by combining fast 10x zircon localization with high resolution 50x inclusion imaging, resulting in the best time efficiency, highest segmentation performance, and superior image resolution thanks to standardized image sizes.
| |
Manual Workflow |
Automated Workflow
1-step segmentation
Using single 50x high-magnification imaging
|
Automated Workflow
2-step segmentation
Using 10x zircon & 50x inclusion imaging
|
| Advantages |
- Full operator control
- No need to optimize sample preparation
|
|
- Best time efficiency
- Highest segmentation performance
- Best image resolution due to standardized image size
|
| Disadvantages |
- User driven
- Highly time intensive
|
- Limited resolution of white-light imaging
- Large datasets due to full-area imaging
- Small inclusions may be missed
|
- Python and COM automation required
|
| Time needed |
Several days |
~ 4 hours |
~ 1 hour 15 min |
Alongside these efficiency gains, the workflow also delivers markedly improved Raman data quality by using Python‑based automated autofocus. This generates stable, high‑quality Raman spectra and significantly enhances identification accuracy, especially for small or optically challenging inclusions. In contrast, the simplified autofocus routine within ParticleScout often fails to reliably locate intensity maxima in very small inclusions, particularly in highly fluorescent or strongly Raman‑active host materials.
For maximum reliability and reproducibility, the advanced autofocus routine in WITec Control SEVEN is recommended, providing superior focus optimization tailored to demanding analytical workflows.
Applicability
This workflow is ideally suited for:
- Geological and mineralogical research
- Provenance and metamorphic studies
- SIMS pre‑screening
- Planetary science
- Materials science involving inclusions or defects within transparent hosts
Conclusions
The combined use of ParticleScout, WITec Control SEVEN, and Python‑based COM automation provides a fast, accurate, reliable, and scalable workflow for detecting opaque inclusions within transparent host mineral grains. The validated approach delivers:
- Rapid zircon grain localisation
- Reliable detection of opaque inclusions
- Automated Raman identification with high spectral quality
- Significant reductions in operator time and manual effort
This automated particle‑in‑particle workflow is a powerful solution for laboratories requiring efficient and reproducible screening across large particle datasets. By distinguishing carbonaceous material—the primary target—from other inclusion types such as iron oxides or rare earth element bearing phases, the workflow enables straightforward transfer of pre‑screening to high‑throughput environments, ensuring traceable, consistent, and objective results for thousands to tens of thousands of minerals that need to be searched to successfully detect and identify carbon-bearing inclusions incorporated in some of the oldest minerals on Earth.
References
[1] Bell, E.A., Boehnke, P., Harrison, T. M., & Mao, W. L. (2015). Potentially biogenic carbon preserved in a 4.1 billion-year-old zircon. Proceedings of the National Academy of Sciences 112(47), 14518-14521.
[2] Vogt, M., Schwarz, W. H., Schmitt, A. K., Schmitt, J., Trieloff, M., Harrison, T. M., & Bell, E. A. (2023). Graphitic inclusions in zircon from early Phanerozoic S-type granite: Implications for the preservation of Hadean biosignatures. Geochimica et Cosmochimica Acta, 349, 23-40.
[3] Schmitt, A. K. (2025). Geochemistry and Cosmochemistry. In Secondary Ion Mass Spectrometry: Fundamentals, Advancements and Applications. Editor Michałowski, P. P., Royal Society of Chemistry, vol. 16, ch. 12, pp. 464-524.

