witec360
View Product
 Part of the Oxford Instruments Group
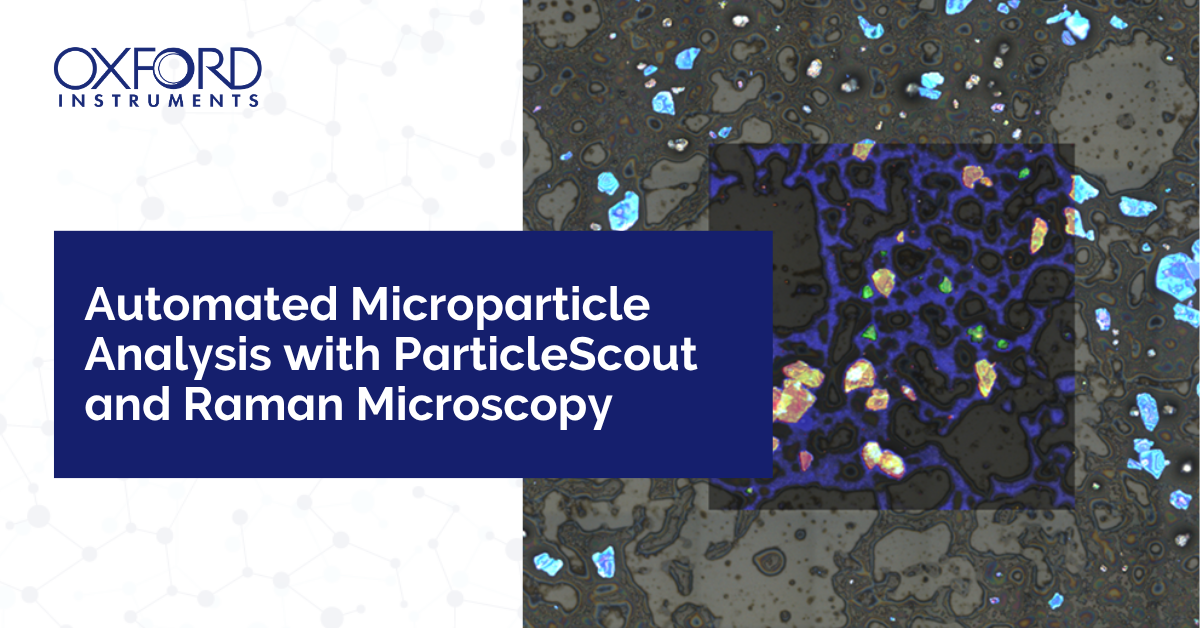
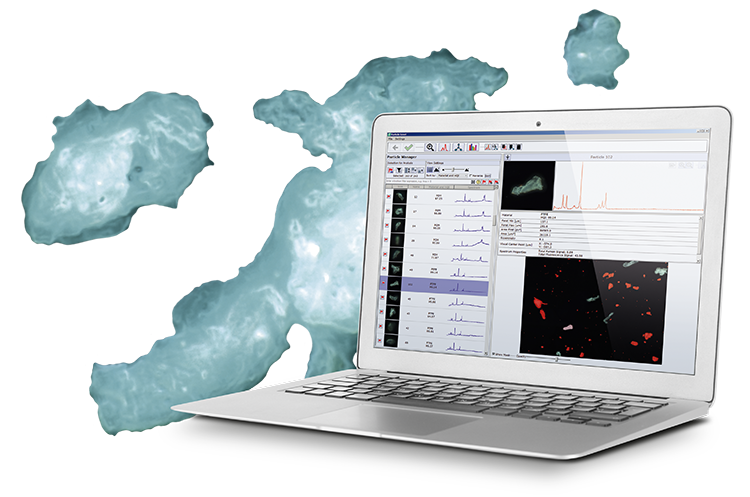
High-resolution measurements of particles are of great interest in many fields of application. Oxford Instruments' ParticleScout is an analysis tool for witec360 Raman microscopes that locates, categorizes, identifies and quantifies particles over even large sample areas. Automated routines sort particles and acquire their Raman spectra, generating reports that provide a detailed overview of the sample.
Pollen, dust, flour, metal flakes and pigments in paints, titanium dioxide in sunscreen and toothpaste, fat crystals in food emulsions – these and many more substances in our daily lives contain or consist of microparticles. Recently, the public and scientific communities have directed their attention towards microplastic particles in the environment.
Confocal Raman microscopy is ideally suited to finding, classifying and identifying microparticles because not only does it yield images with a resolution down to 200 nm, but with Raman vibrational spectroscopy the chemical components of a sample can be identified. It is a non-destructive method that requires little, if any, sample preparation. A Raman microscope can generate high-resolution images that show both the structural features and distribution of molecules within a sample. However, Raman spectroscopic imaging is not yet widely applied to microparticle analysis.
The challenge in Raman microparticle analyses lies in automating the detection of individual particles and classifying those of interest by size or shape before determining their chemical compositions. For such analyses, we have developed ParticleScout. In combination with an Oxford Instruments witec360 Raman microscope, this tool enables measurements that proceed from a white light sample overview to particle detection, acquisition of Raman spectra, post-processing of spectra and chemical identification to creating a final report. During this procedure the user can define the criteria according to which the particles shall be investigated, such as area, perimeter, minimum/maximum Feret diameter, elongation, equivalent diameter and many more.
Click on the buttons to navigate to your application area of interest
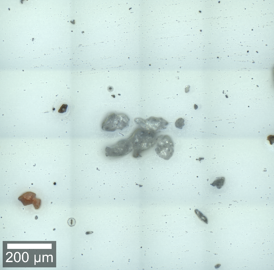
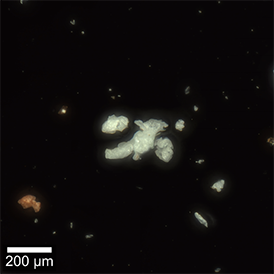
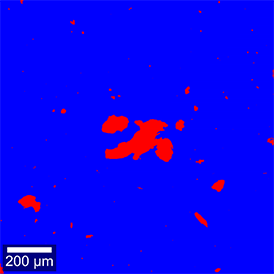
In order to illustrate the workflow of microparticle analysis, a mixture of microplastics was analyzed with an Oxford Instruments Raman microscope equipped with ParticleScout. First, large-area brightfield (Figure 1A) and dark-field (Figure 1B) images were recorded by image stitching. This technique combines images from adjacent sample areas into one composite, so that high-resolution images of large areas can be acquired. Additionally, focus stacking yielded sharp outlines for all the differently sized particles by combining images from different focal planes (Figure 1A, B).
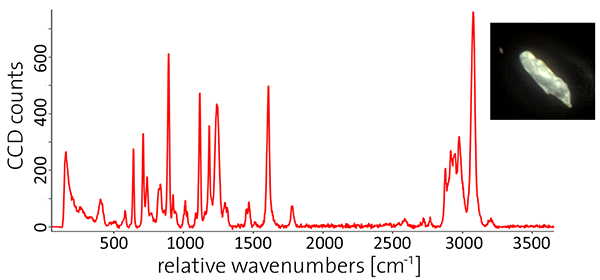
A software algorithm detected particles in the overview image through a brightness threshold and represented their positions in the form of a two-color image (Figure 1C). For each particle, structural characteristics were calculated automatically, such as area, perimeter, aspect ratio and many more. Conventional Raman imaging of large areas would include much of the empty space surrounding the sparsely distributed particles. In order to accelerate the measurement, ParticleScout automatically records spectra of selected particles only (see Figure 1D for an example).
After processing the spectra (i.e. background subtraction) the particles were chemically identified using the seamlessly- integrated TrueMatch Raman database management software. TrueMatch automatically searches commercial or custom databases quickly and identifies particles reliably.
Finally, a report was generated (Table 1) that summarized the abundance and physical properties of the different materials in the sample. The relative abundance of the sample components is illustrated graphically (Figure 1E). As particle classification, image processing and analysis of Raman spectra are executed within one platform, ParticleScout offers an effective solution for automated, comprehensive investigations of particles.
A)
B)
C)
D)
E)
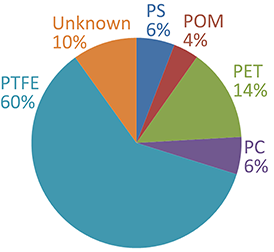
Figure 1: Analysis of a mixed microplastic sample using ParticleScout
(A-B) Large-area (1 mm x 1 mm) bright-field (A) and dark-field (B) views of a mixture of microplastic particles were generated using image stitching and focus stacking. (C) Particles are automatically detected through a brightness threshold and represented as a two-color mask. (D) Background-corrected Raman spectrum of an example particle. (E) Composition of the mixed plastic sample. After processing the spectra, the chemical compositions of the individual particles were identified using TrueMatch (see Table 1). PS: polystyrene; POM: polyoxymethylene; PET: polyethylene terephthalate; PC: polycarbonate; PTFE: polytetrafluoroethylene; Unknown: unidentified particles.
Image courtesy: Oxford Instruments
Table 1: Composition of a mixed microplastic sample
Abundance and particle size distribution for the identified materials. See Figure 1 for abbreviations.
| Sum | 5 - 10 µm | 10 - 20 µm | 20 -50 µm | 50 - 100 µm | > 100 µm | |
| PS | 89 | 47 | 12 | 8 | 17 | 5 |
| POM | 59 | 34 | 12 | 8 | 4 | 1 |
| PET | 217 | 106 | 70 | 20 | 17 | 4 |
| PC | 87 | 18 | 45 | 17 | 7 | 0 |
| PTFE | 913 | 417 | 297 | 103 | 77 | 19 |
| Unknown | 150 | 45 | 78 | 8 | 19 | 0 |
| Sum | 1515 | 667 | 514 | 164 | 141 | 29 |
Environmental pollution by microplastics is a growing concern because of their potentially harmful effects on human health and ecosystems. For assessing such effects, microplastics in environmental samples need to be quickly and reliably identified and their abundance and size distribution must be quantified.
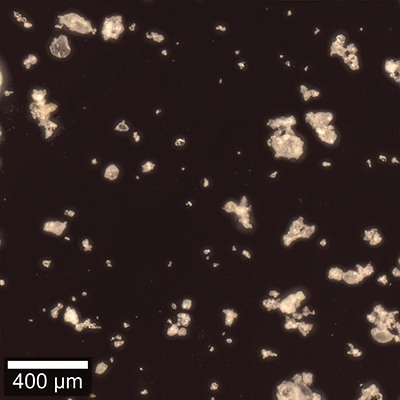
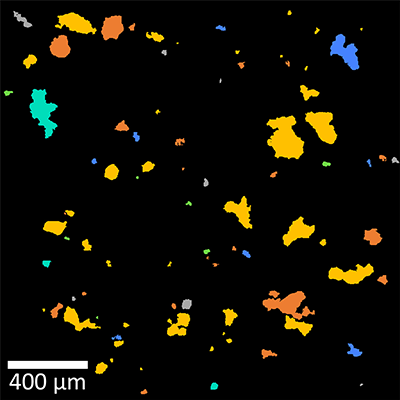
The aim of the following measurement was to quantify the amount of microplastic particles in a sludge sample from a wastewater treatment plant (sample courtesy of Dieter Fischer, Leibniz Institute of Polymer Research, Dresden, Germany). The sludge sample (50 g) was pretreated, purified and filtered.
Figure 2 shows the dark-field image of a filter (pore size 10 μm) on which tens of thousands of particles from the sludge sample were retained. ParticleScout automatically measured Raman spectra for about 18,000 particles. Out of these, 46 were nambiguously identified as microplastics by the database software TrueMatch, corresponding to about 0.25 % of all measured particles. The most abundant types of microplastics were polyethylene (25 particles) and polypropylene (12 particles). Their sizes ranged from 10 μm to 100 μm (circular equivalent diameter). Particles in this size range can be ingested by diverse marine organisms, but their potential consequences are still subject to investigation.
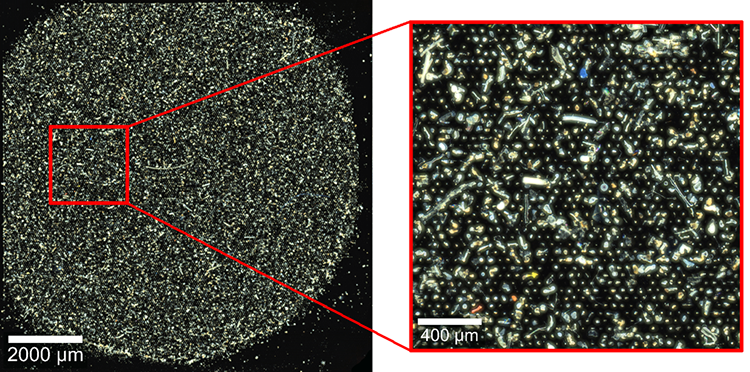 Figure 2: Microplastics in a wastewater treatment plant sludge sample
Dark-field image of a silicon filter with 10 μm pore size (left) and zoom-in image of the area marked in red (right). About 0.25 % of all investigated particles were microplastics.
Sample courtesy of Dieter Fischer, Leibniz Institute of Polymer Research, Dresden, Germany
A detailed microparticle analysis typically consists of the five following steps. A high level of automation is required because manually inspecting a large number of particles is time-consuming and error-prone.
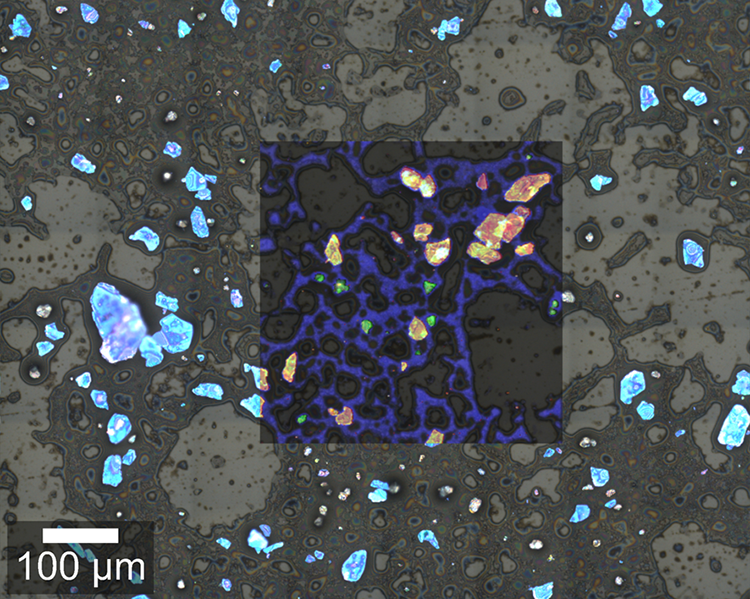
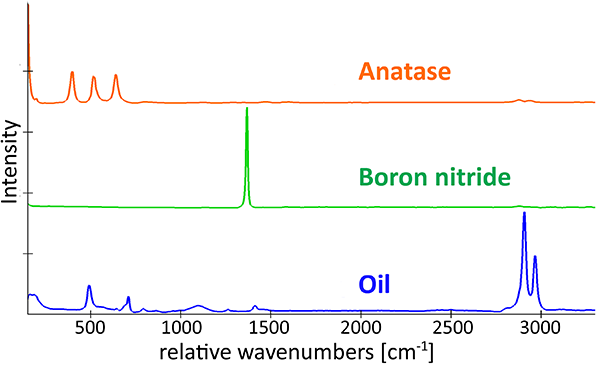
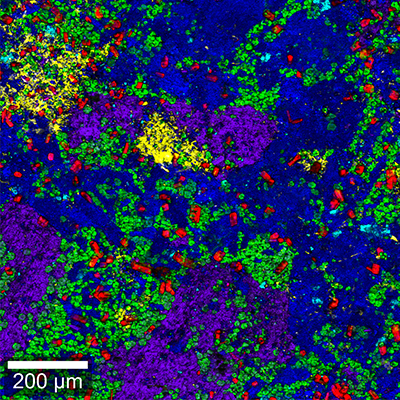
In some pharmaceutical and cosmetic products, microparticles are responsible for the desired effects or consistency. Here, a cosmetic peeling cream was analyzed using an Oxford Instruments Raman microscope equipped with ParticleScout. First, a large-area image was generated by image stitching (section shown in Fig. 3A). In the bright-field image, crystalline particles are clearly visible as bright blue structures, while the cream matrix appears as dark grey. A complete Raman image was acquired for a subsection of the image and overlaid, visualizing the spatial distribution of the sample components. The Raman image is color coded according to the recorded spectra of the identified components (Fig. 3B), showing that the cream consists mainly of anatase and boron nitride particles in an oil matrix. Anatase is a form of titanium dioxide and causes the peeling effect, while boron nitride is often used in cosmetics as a slip modifier.
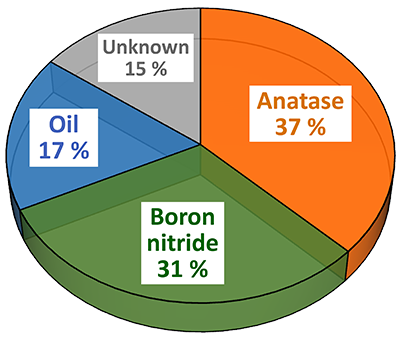
In the next step, ParticleScout was used to analyze the cream’s composition in more detail. Raman spectra were acquired automatically for 3941 particles. With the seamlessly-integrated TrueMatch software, the recorded Raman spectra were processed and the particles were identified by referencing the Raman database. Quantification of the sample components revealed 37 % anatase and 31 % boron nitride particles in the cream (Fig. 3C). The particles were further categorized according to their physical shape and size using Boolean filters. For example, the size distributions of the anatase and boron nitride particles were compared (Fig. 3D). For this histogram, the projection area was used as a measure for the particle size, but other parameters such as perimeter, bounding box, Feret diameter, aspect ratio or circular equivalent diameter could also be used for similar analyses.
A)
B)
C)
D)
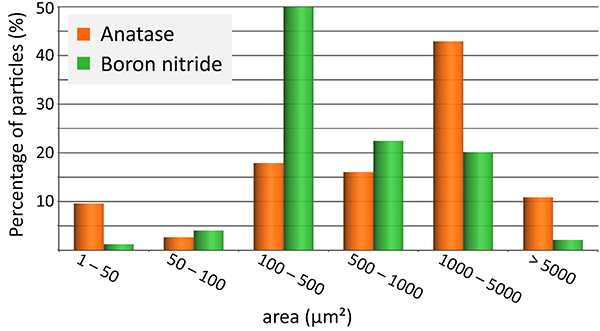
Figure 3: Particles in a cosmetic peeling cream.
(A) Optical bright-field image overlaid with the confocal Raman image color coded according to the spectra in (B). (B) Raman spectra of the molecular components in the sample: anatase (orange), boron nitride (green) and oil (blue). (C) Pie chart of the compound distribution in the sample: 37 % anatase (orange), 31 % boron nitride (green), 17 % oil (blue), 15 % not identified (grey). (D) Area distribution of the anatase (orange) and boron nitride (green) particles.
Image courtesy: Oxford Instruments
Qualitative and quantitative microparticle analyses are of interest for research, development and quality control in the pharmaceutical industry, as the efficacy and safety of drugs depend on the composition and particle size of the substances contained [1].
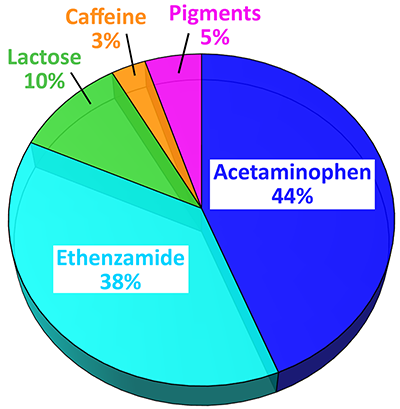
Here, an analgesic (pain-killing) and antipyretic (anti-fever) powder sample was investigated with ParticleScout by first acquiring a dark-field overview image. In order to exclude aggregates from the investigation, only particles with a diameter of less than 100 μm were selected and Raman spectra were automatically acquired from more than 3000 particles. Due to ParticleScout’s integration time optimization feature, many hundreds of particles could be analyzed per hour. The Oxford Instruments Raman microscope used for the experiment was able to target even very small particles for the Raman spectrum acquisition and particles with an area down to 1 μm² were considered for the measurement. After identifying the particles by their Raman spectra, a quantitative report describing the proportions and size distributions of the substances was generated. The presented pie charts compare the percentage of particles (Figure 4A) and the area fractions (Figure 4B) for each substance. The majority of the particles were the analgesic agents acetaminophen and ethenzamide. Other substances were detected, including caffeine as an adjuvant for improved pain relief, lactose as a carrier, and white pigment.
A)
B)
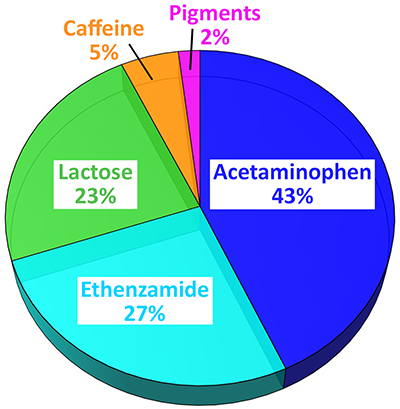
Figure 4: Raman-based particle analysis of a pharmaceutical powder
Percentage (A) and area fraction (B) for the identified particles: Acetaminophen (blue, 1340 particles), ethenzamide (cyan, 1154 particles), lactose (green, 308 particles), white pigment (pink, 155 particles), and caffeine (orange, 95 particles).
Image courtesy: Oxford Instruments
In addition to the characterization of powders, analyses of other sample forms can also profit from the capabilities of ParticleScout. In pharmaceutical tablets, the grain size of an ingredient can influence the tablet’s properties.
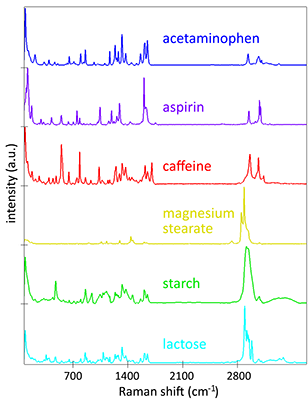
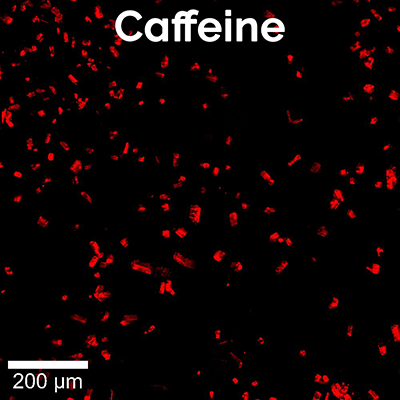
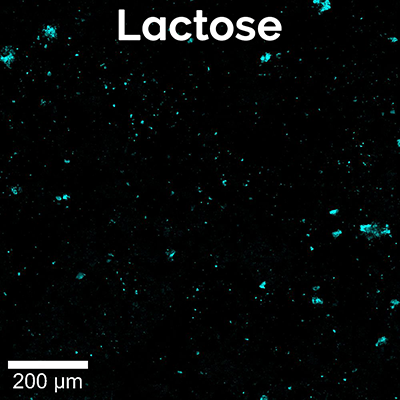
Here, a high-resolution, large-area Raman image of a painkiller tablet’s surface was recorded (Figure 5A). It shows the distribution of its main chemical compounds color coded according to their Raman spectra (Figure 5B). The main analgesic ingredients were acetaminophen and aspirin. The tablet also contained caffeine as an adjuvant, magnesium stearate as a lubricant and lactose and starch as fillers and binders. Both caffeine and lactose were present mostly in small defined spots, but caffeine seemed to be found in slightly larger grains. By analyzing the Raman images of the individual components (Figure 5C) with ParticleScout, quantitative grain size distributions could be obtained.
For the caffeine and lactose identified on the tablet surface, ParticleScout located hundreds of individual grains and sorted them according to size. The area size distributions for both components reveal that lactose indeed formed smaller grains on average than caffeine (Figure 5D). More than 90% of the lactose, but only 24% of the caffeine grains, showed areas smaller than 50 μm².
A)
B)
C)
D)
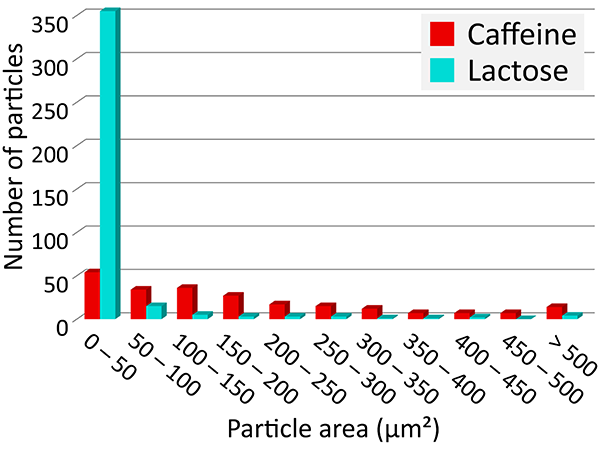
Figure 5: Raman analysis of a painkiller tablet.
(A) High-resolution, large-area Raman image of the tablet’s surface, color coded according to the spectra in (B): acetaminophen (blue), aspirin (purple), caffeine (red), magnesium stearate (yellow), starch (green), lactose (cyan). 1 x 1 mm² with 1000 x 1000 pixels. (B) Corresponding Raman spectra. (C) Individual Raman images of caffeine (left, red) and lactose (right, cyan) used for analysis with ParticleScout. (D) Grain size distributions for lactose (cyan) and caffeine (red).
Image courtesy: Oxford Instruments
In many applications, only a fraction of the particles in a sample is of scientific interest. Particles in mixed samples must therefore be selected according to physical properties and further analysis will then be limited to those that meet the specified criteria.
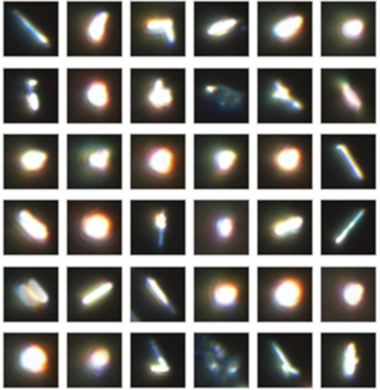
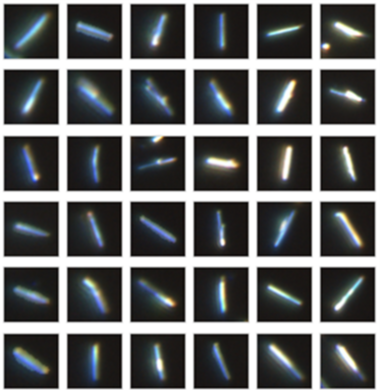
The following example shows how ParticleScout can be used to isolate particles of interest quickly and conveniently. The sample contained tungsten disulfide (WS₂) nanowires, prepared by Reshef Tenne (Weizmann Institute, Israel) and kindly provided through Martin Konečný and Tomáš Šikola (CEITEC, Institute of Physical Engineering, Brno University of Technology, Czech Republic).
Using an Oxford Instruments Raman microscope equipped with ParticleScout, several thousand particles were located on the silicon dioxide substrate, but not all of them were the desired nanowires (Figure 6A). These structures are several micrometers long, but only a few hundred nanometers thick. Manually inspecting all particles and selecting the nanowires would be tedious and time-consuming. Using ParticleScout, the desired nanowires were isolated within seconds by their elongated shape: Specifying an aspect ratio of greater than 2.5 yielded 218 nanowires (Figure 6B), which could be further investigated. For example, Raman spectra could be acquired from every particle to confirm that they consist of WS₂. Measurements with different laser polarizations demonstrated the anisotropic scattering behavior of the nanowires: The intensity of the Raman shift peak at 421 cm⁻¹ depends on the orientation of the nanowire with respect to the polarization of the excitation light (Figure 6C).
A)
B)
C)
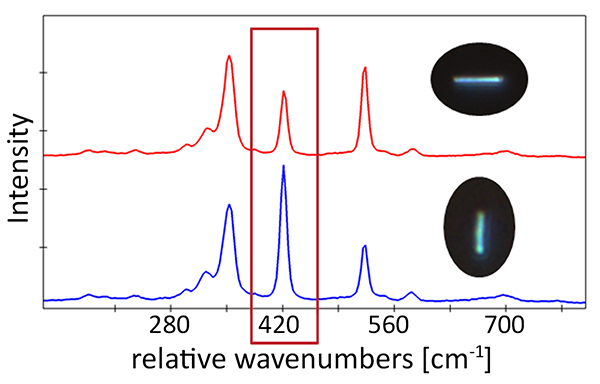
Figure 6: ParticleScout distinguishes WS₂ nanowires from globular particles within seconds
(A) Representative subset of the 3135 particles of less than 5 μm in length detected in a sample of WS₂ nanowires on silicon dioxide. (B) Representative subset of the 218 nanowires isolated by additionally specifying an aspect ratio of greater than 2.5. (C) Raman spectra for two orientations of nanowires with respect to the polarization of the laser light. The intensity at 421 cm⁻¹ depends on the angle between the nanowire and the laser polarization.
Sample courtesy of Reshef Tenne (Weizmann Institute, Israel), Martin Konečný and Tomáš Šikola (CEITEC, Institute of Physical Engineering, Brno University of Technology, Czech Republic)
Many ingredients for baking and cooking are particulate, for example flour, sugar, salt, baking powder, semolina, starch and many spices, and their size and distribution influence the macroscopic properties of food products. In drinks such as beer, the analysis of haze particles is an important task [2]. Comprehensive particle analyses are thus relevant for research, development and quality control in the food and drink industries. Apart from characterizing particulate products, the detection of microplastic particles is important as microplastics are becoming increasingly prevalent and their potentially harmful effects on humans and animals continue to be investigated [3].
Here we demonstrate particle analysis with Raman spectroscopy using an Oxford Instruments Raman microscope equipped with ParticleScout. For this purpose, a mixture of typical particulate baking ingredients was spread on a cover slide and wide-field images were acquired at different sample positions. The dark-field image of one area is shown in Figure 7A. Raman spectra were recorded automatically for the particles in all images and identified using the integrated TrueMatch database management software. Figure 7B shows the same sample area as Figure 7A, but with the analyzed particles color-coded according to their chemical identities. As the different particle types have different average sizes, their abundance is represented by their area fraction in Figure 7C. Starch and smaller oligo- and polysaccharides, which are the main components of flour, account for two thirds of the mixture. Sugar and vanilla sugar represent about 15% and baking powder 5%. The remaining 5% include, for example, some proteins. More detailed analyses of the particles’ shapes and sizes would of course be possible after measuring a more statistically significant number of particles.
A)
B)
C)
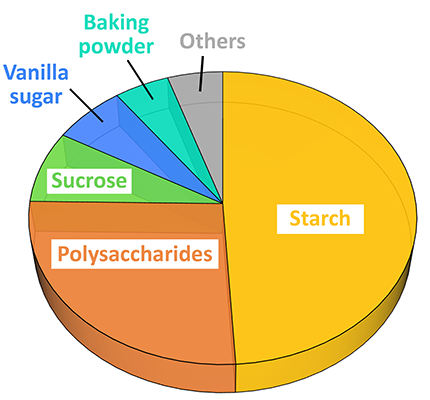
Figure 7: Particle analysis with Raman spectroscopy in a mixture of baking ingredients
(A) Dark-field image of the particles in a mixture of typical baking ingredients. (B) The particles located in (A) were color-coded according to their Raman spectra: starch (yellow), polysaccharides (orange), sucrose (green), vanilla sugar (blue), baking powder (cyan), others (grey). Particles at the picture edges were not analyzed. (C) The components’ area fractions. In total, 139 particles were identified.
Image courtesy: Oxford Instruments
[1] T.F. Haefele, K. Paulus, Confocal Raman microscopy in pharmaceutical development. In: Confocal Raman Microscopy, J. Toporski, T. Dieing, and O. Hollricher (Editors) Springer International Publishing AG, 2nd edition (2018) p. 381-419. DOI: 10.1007/978-3-319-75380-5_16
[2] E.-M. Kahle et al. (2020). Identification and differentiation of haze substances using Raman microspectroscopy. J. Inst. Brew., 126: 362 – 370. DOI: 10.1002/jib.627
[3] N.P. Ivleva et al. (2017). Microplastic in Aquatic Ecosystems, Angew. Chem. Int. Ed., 56: 1720 – 1739. DOI: 10.1002/anie.201606957

© Oxford Instruments 2026