witec360
View Product
 Part of the Oxford Instruments Group
While microplastic analysis has become an established field of research, the characterisation of nanoplastics - polymer particles typically smaller than 1000 nm - remains a major analytical challenge. Many established methods, including Raman-based particle analysis, are fundamentally constrained by the optical diffraction limit. As particle dimensions approach or fall below this limit, their detection, confident identification, and size characterisation become increasingly difficult using conventional Raman microscopy.
This Application Note demonstrates how automated correlative microscopy can overcome these limitations to characterise particles down to 200 nm. By combining the chemical specificity of Raman spectroscopy (via ParticleScout) with the nanometre‑scale dimensional accuracy of atomic force microscopy (AFM), we push automated particle analysis to its practical limits. The integrated workflow delivers a level of completeness and reliability unattainable by either technique alone.
The resulting correlative method bridges the gap between optical and nanoscale characterisation, enabling precise detection, sizing, and identification of nanoplastics with improved robustness and analytical confidence.
Workflow Overview

Sample Preparation
Micro- and nanoplastic contaminants relevant for biological or environmental questions often originate from food packaging materials or processing equipment. To represent such contamination while maintaining matrix simplicity, drinking water is an ideal test system: it can be filtered easily and introduces no interfering particulate background.
To evaluate the limits of the correlative workflow, a simulated model sample was prepared. Mineral water was spiked with polymer beads of known composition and size, and 100 mL of the suspension was filtered. Measurements were performed directly on the filtration substrate.
The filters have to be sufficiently flat to being able to distinguish particles from filter features, and should give no Raman background themselves, due to the delicate signal from the particles.
This makes alumina oxide membrane filters (Al2O3, 0.2 µm, 47 mm) or silicon filters a very suitable substrate for these kinds of investigations. Alumina oxide filters are sufficiently flat and give a medium Raman background of only a few bands. Less suitable are, for example, polycarbonate filters (due to their strong Raman-bands in the fingerprint region) or cellulose filters (because of their increased roughness).
Instrument Setup
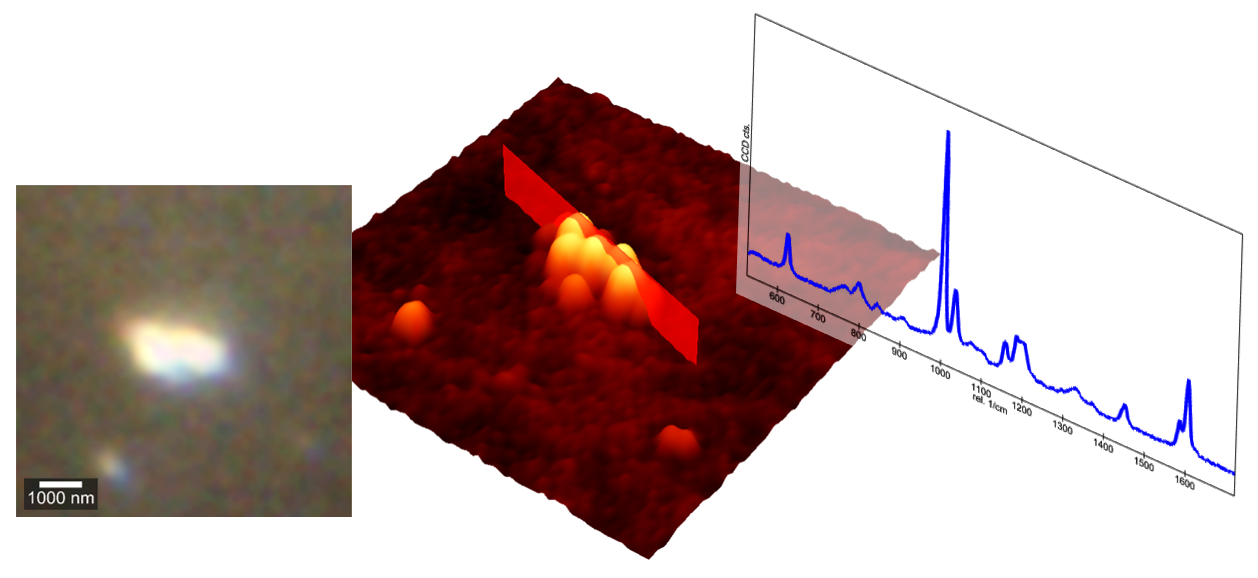
Counterintuitively, sub-resolution limit particles can still produce detectable Raman spectra and even be visible in the camera image under certain circumstances. The consequence of diffraction-limited image acquisition is that the particles appear blurred, or more specifically, as a convolution with the point spread function. Therefore, a Raman spectrum can be obtained from a particle smaller than the detection volume, especially when being able to control laser power and integration time. The high confocality of the witec360 Raman microscopes minimises background contributions, allowing detection of weak signals from nanoscale particles.
The instrument used is a witec360 correlative Raman-AFM microscope with 532 nm excitation wavelength. Especially important for particle investigations are the extensions of dark field mode microscopy and ParticleScout. A high magnification bright/dark field objective (i.e. 100x) is used for the optical particle image as well as for Raman spectroscopy. ParticleScout identifies particles based on optical contrast. The use of dark‑field illumination greatly improves visibility, especially on flat substrates such as alumina oxide or silicon.
Measurement Acquisition
The ParticleScout automatically acquires one Raman spectrum for each identified particle. Which particles are measured can be pre-filtered, for example by size or shape. In this study, only particles of an area < 5 µm2 are considered for analysis.
The acquisition was conducted with an excitation of 532 nm at 5.0 mW, using an objective with 100x magnification and NA 0.9. The spectra were integrated for 3 s with seven accumulations. The focal position remained constant, optimised on one particle prior to measurement.
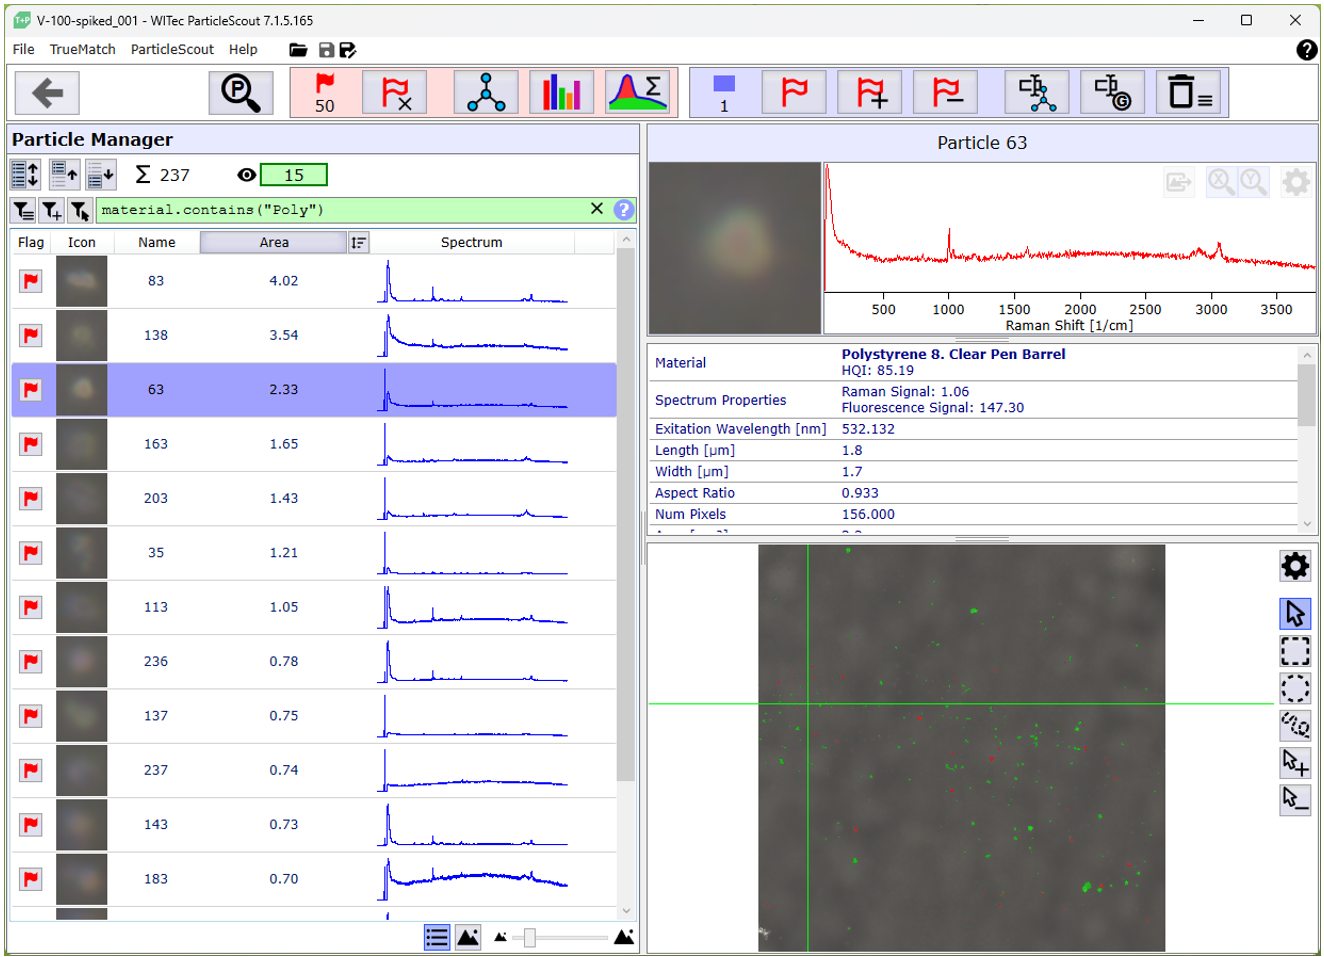
Figure 1: Interface of the ParticleScout. Particles to be measured can be selected by filter or manually from the particle overview list on the left. The upper right part shows the details for any selected particle. The darkfield image of the sample is displayed at the bottom right.
After database identification using TrueMatch and the St. Japan spectral database, the particles can be filtered so that only those particles which were successfully identified as polymers are used for further AFM analysis. In this proof of concept, 15 particles were traced back to polymer materials and investigated further. For an optimal hit rate, objectives should be properly calibrated and compensated and autofocus may be used.
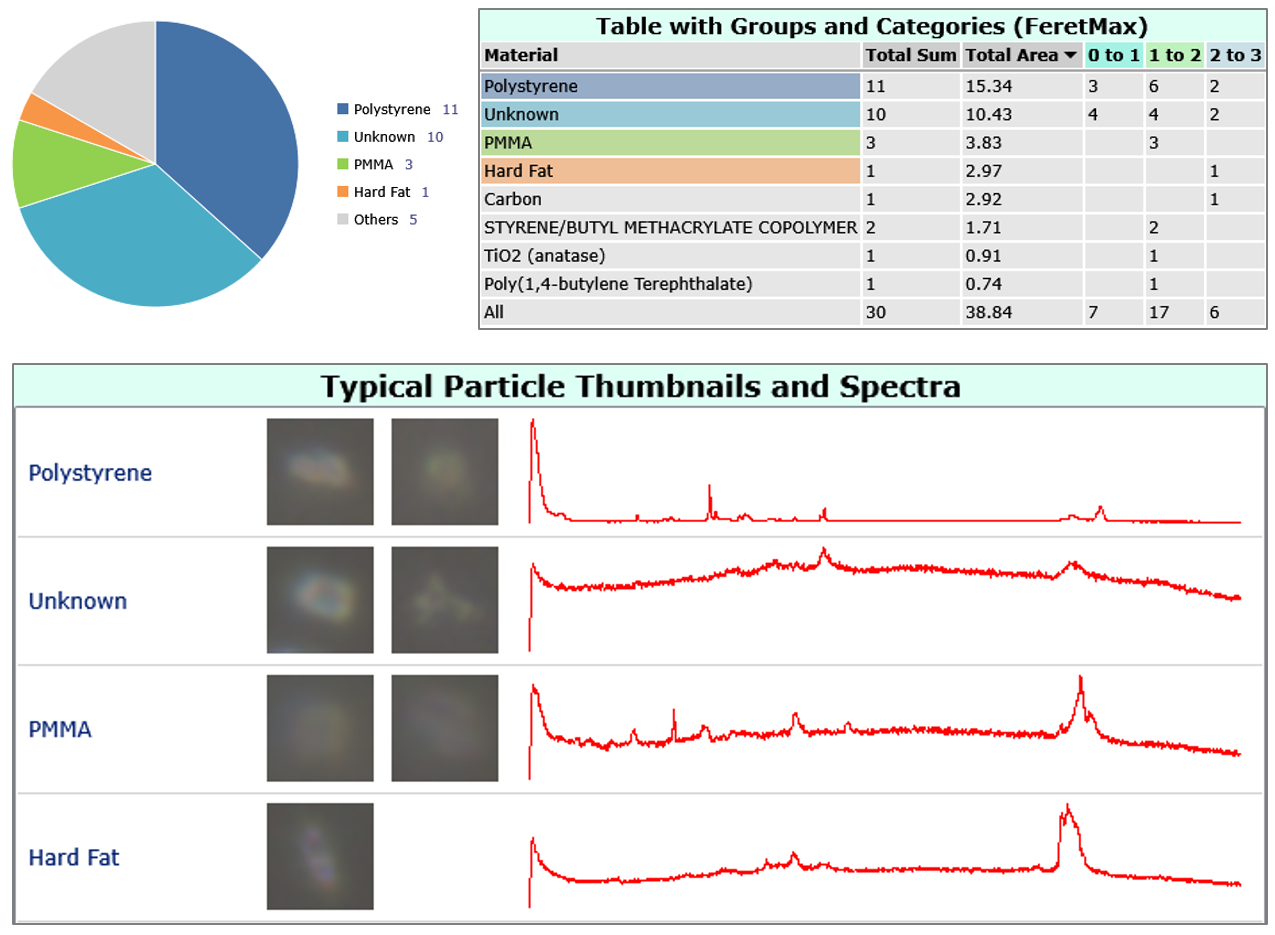
Figure 2: Reporting in ParticleScout. Automatically generated figures and tables about the identified materials and their distribution among the particles.
ParticleScout provides geometric data for each detected particle, including the centre coordinates. Since the witec360 systems are fully integrated, measuring modes can be switched seamlessly, without the need to exchange components or move the sample. This way, these coordinates can be transferred to the Sample Raster’s Point List Editor, which then allows automated execution of AFM process scripts at each particle position in a straightforward workflow.
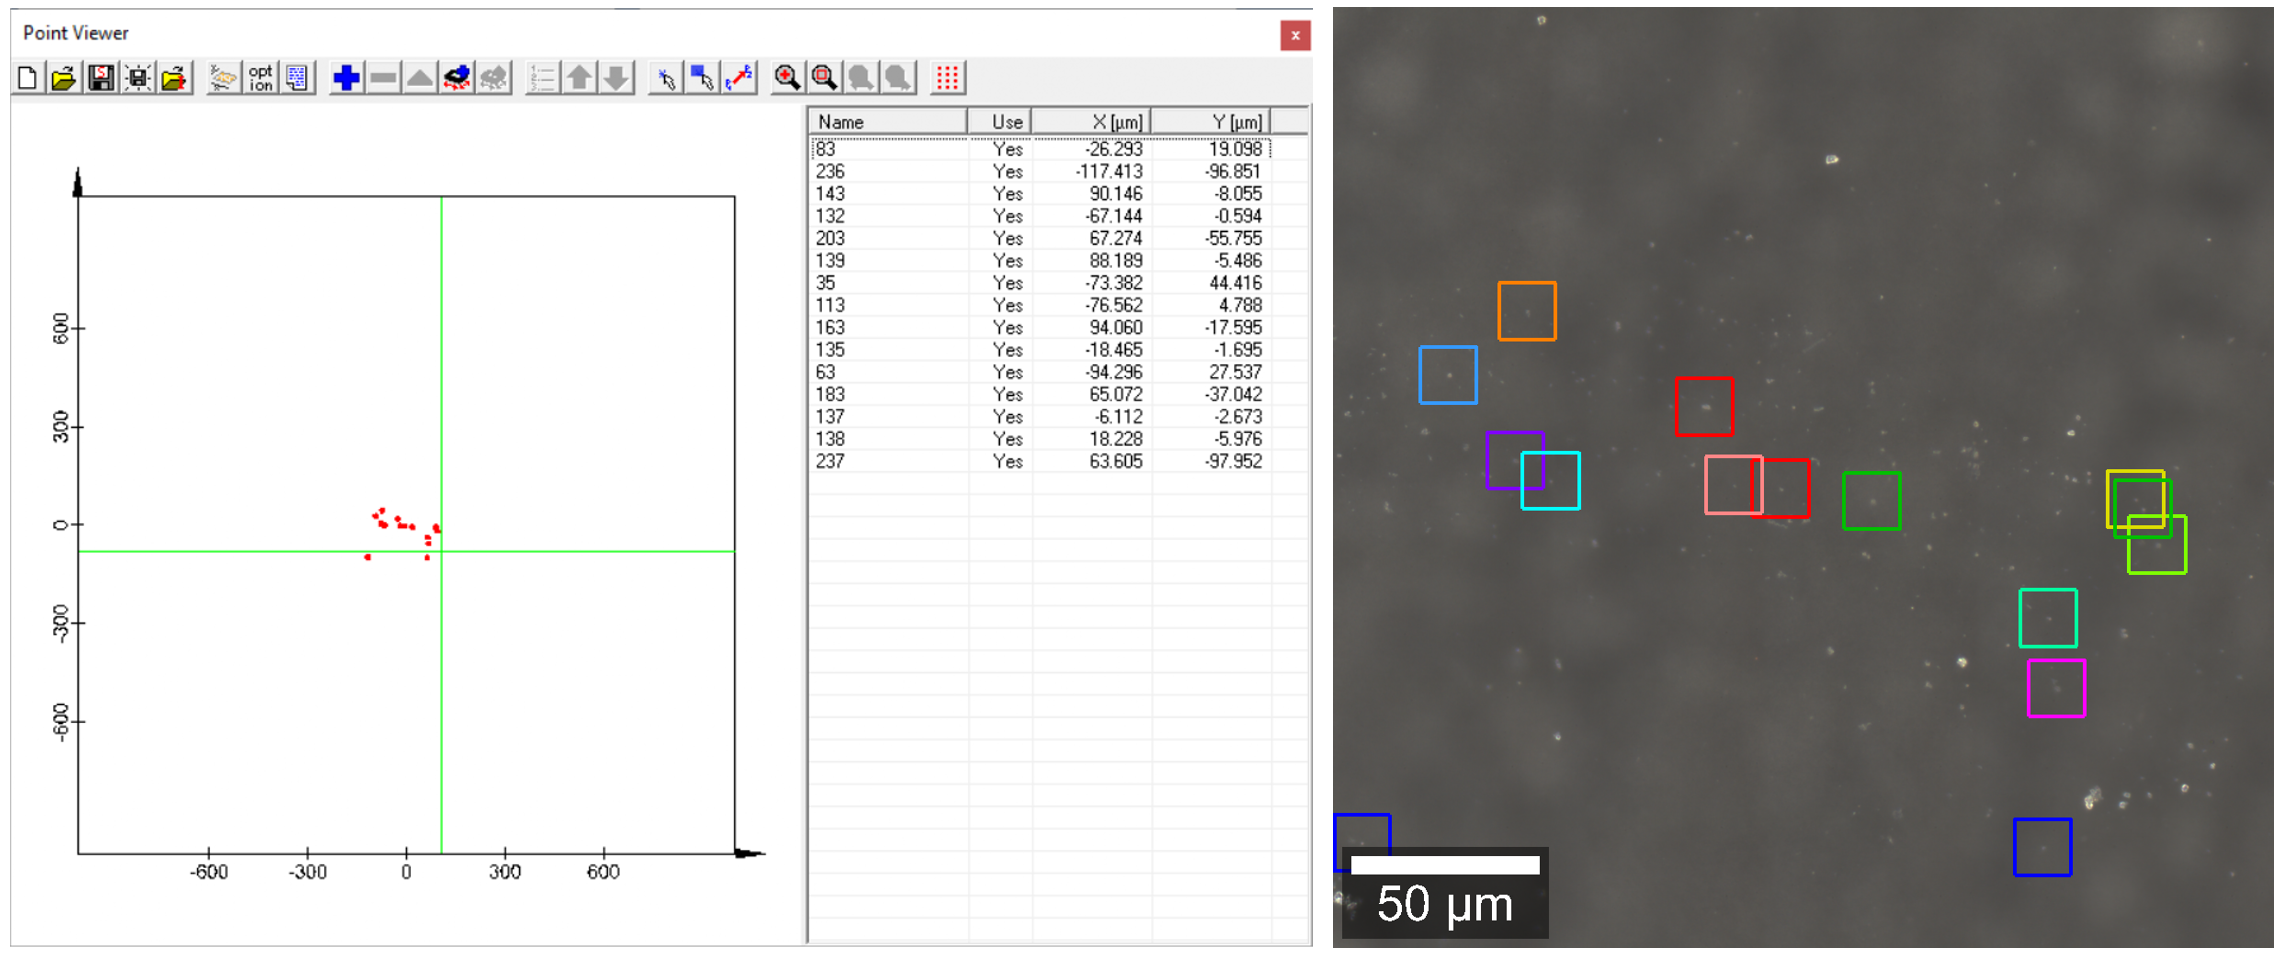
Figure 3: Point List Editor of the Sample Raster function (left) and the optical overview stitching image (right), showing the positions of the individual AFM images.
Tipp for users: This process script for AFM automatically approaches the tip, performs the image scan (assuming being in AFM mode) and retracts the tip (the vertical distance can be defined, setting 20 µm). The position commands ensure that the approach is done in the image centre: storeposition; tipapproach; imagescan; movezmicroscope; gotoposition
A low pixel number is sufficient while keeping the total measurement time short. Here, an image size of 15x15 µm2 with 150x100 pixels is chosen. A line time of 1 sec/line results in approximately 5 min per image. For the 15 particles in this example, the whole AFM measurement duration amounts to 1h 18min, including movement and approach times, without any user interaction required.
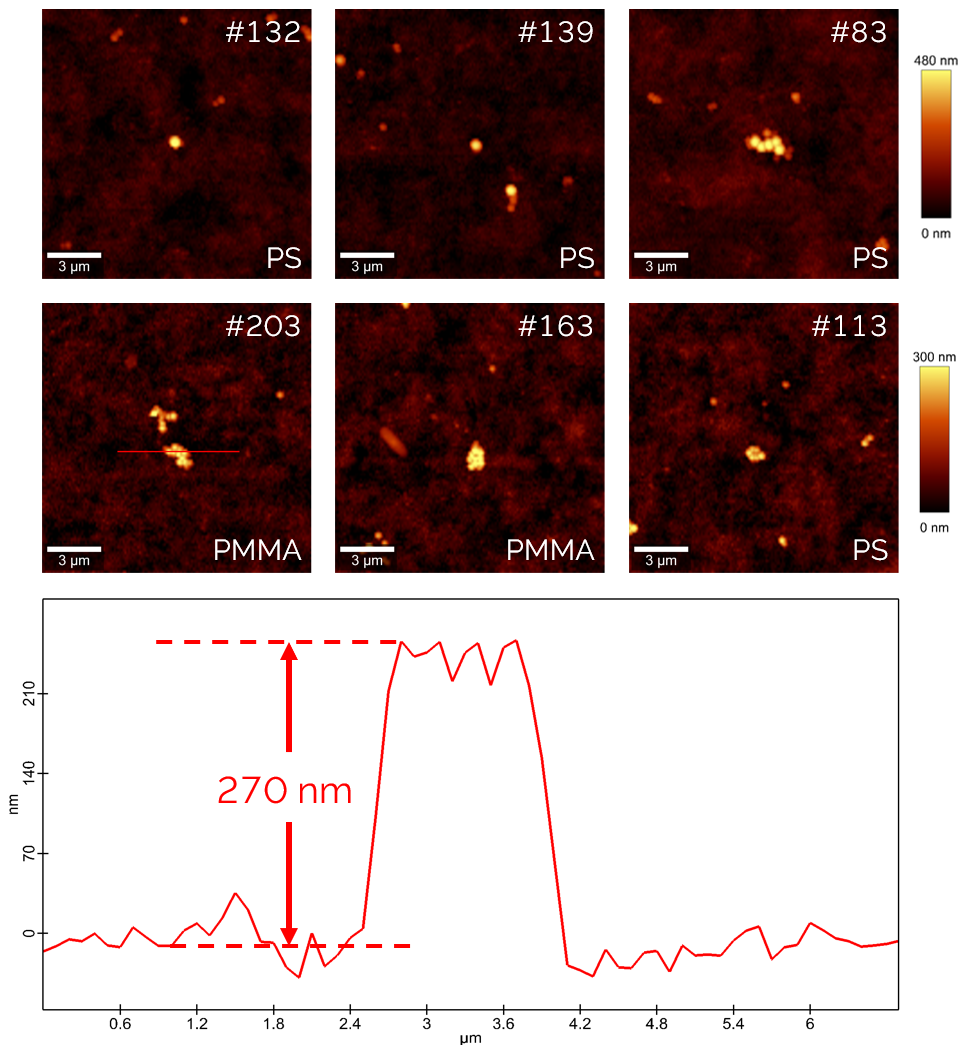
Figure 4: Exemplary topography images and a height profile from automated AFM measurements. Some of the particles are found to be individual particles; others are small agglomerations. As seen in the figure, the particles are always in the center of the image. This showcases the stability of the system and would allow for even smaller images and faster measurements.
Data Analysis
Each AFM image was processed using a polynomial plane subtraction (order 5) to correct for background membrane topography. Due to the simple particle morphology, no masking was required.
For nanoscale particles, the height profile provides the most reliable size metric. Lateral dimensions are influenced by tip convolution and particle clustering, but height measurements remain robust. The particle height was therefore taken from the maximum value of a cross-section profile.
Results
Height values from AFM were merged with the Raman-based material identifications to produce a correlative dataset. In the example measured here: Polystyrene (PS) beads occurred in two size populations (~275 nm and ~500 nm). Poly(methyl methacrylate) (PMMA) appeared only in the smaller population (~275 nm).
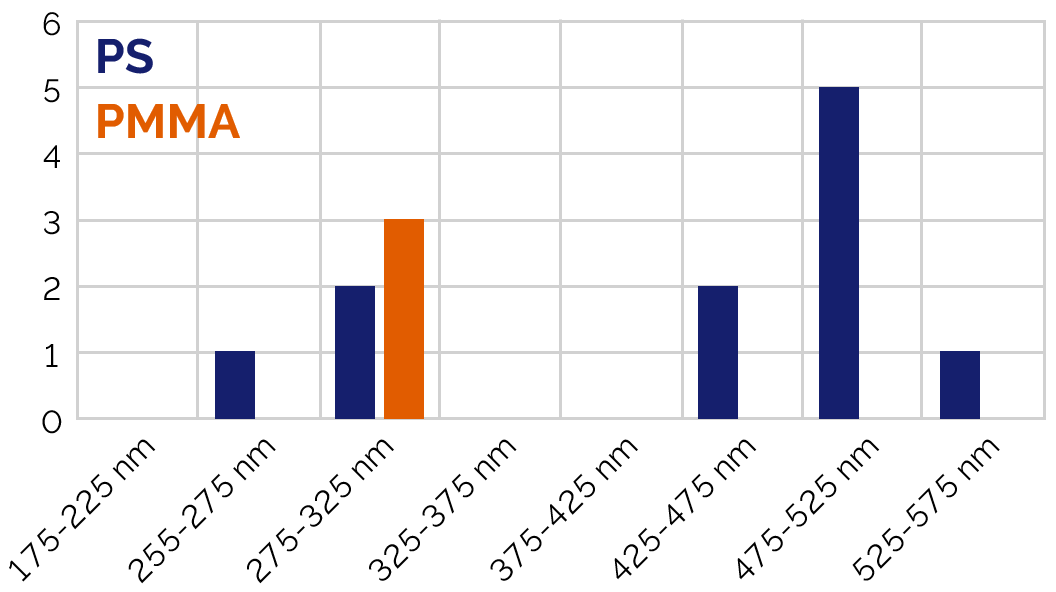
Figure 5: Histogram of particle heights from AFM correlated with chemical ID from ParticleScout.
Despite the limited number of particles, the combined Raman-AFM approach clearly demonstrates the strengths of correlative analysis:
Together, they enable confident characterisation of nanoscale particles otherwise inaccessible by either technique in isolation.
Summary
Date: May 2026
Author: Niklas Biere, Miriam Boehmler
Category: Application Note

© Oxford Instruments 2026